mission chocolate
Mission Chocolate runs 4 products across 2 aisles, stocked in a single San Francisco grocer. Its biggest footprint is candy, at 1% of the shelf. A niche presence — Brand Power 36/100.
Shelf presence
Brand Power (0–100) blends four shelf signals. Premium is shown for context — it's a price-position read, not part of the score.
carried in 1 of 3 San Francisco grocers. how many stores stock the brand.
4 products in the catalog. how deep the product line is (saturating).
spans 2 aisles. how many aisles the brand plays in (saturating).
~13% average share on the shelves it competes on. how dominant it is where it shows up.
priced above 95% of same-category rivals. where it sits on price vs category peers — context, not scored into Brand Power.
Where it owns shelf
each bar is the % of that aisle's SKUs that are Mission Chocolate (full bar = 100% of the shelf), grouped by department.
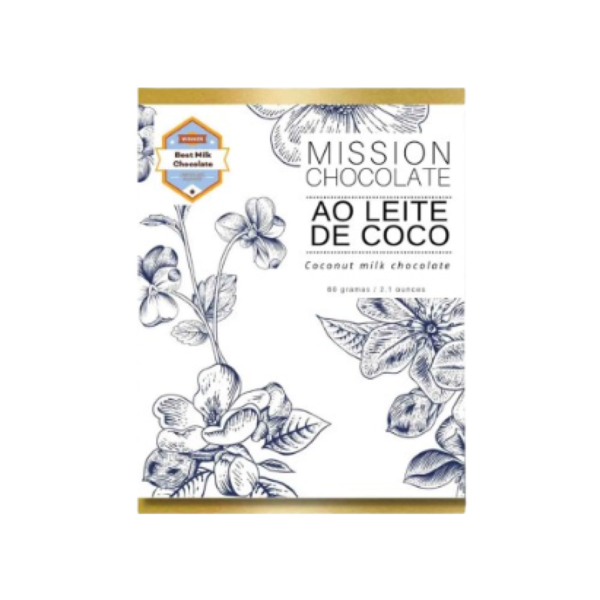
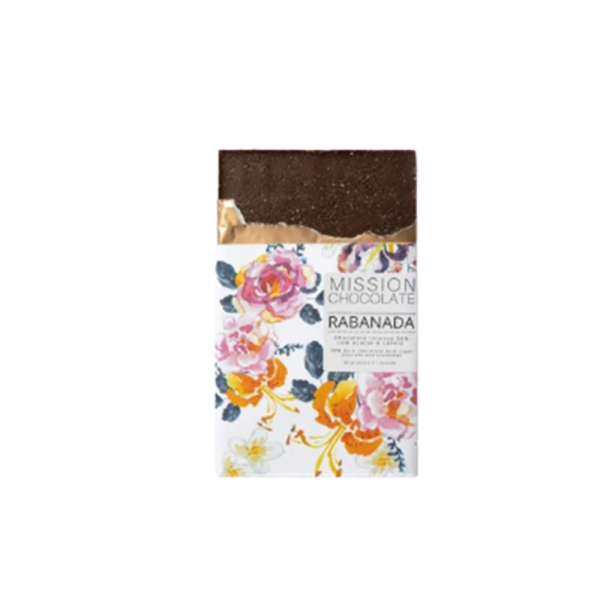
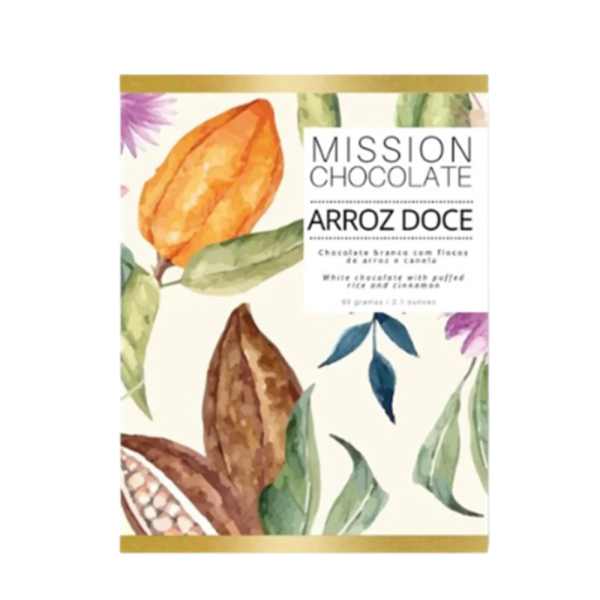
The lineup
every Mission Chocolate product in stock, cheapest first.