norfolk manor
Norfolk Manor runs 2 products across 2 categories, stocked in 2 of 24 Bay Area grocers. Its biggest footprint is condiments, at <1% of the shelf. A niche presence · Brand Power 12/100.
Shelf presence
Brand Power (0-100) blends four shelf signals. Price position is shown below for context · a value↔premium read, not part of the score.
carried in 2 of 24 Bay Area grocers. how many stores stock the brand.
2 products in the catalog. how deep the product line is (saturating).
spans 2 categories. how many categories the brand plays in (saturating).
Where it owns shelf
each bar is the % of that category's SKUs that are Norfolk Manor (full bar = 100% of the shelf), grouped by department.
Top competitors
the brands crowding the same categories as Norfolk Manor · photographed shelf-mates first, then brands stocked beside it at the same grocers, then same-category rivals citywide.

The lineup
every Norfolk Manor product in stock, cheapest first.
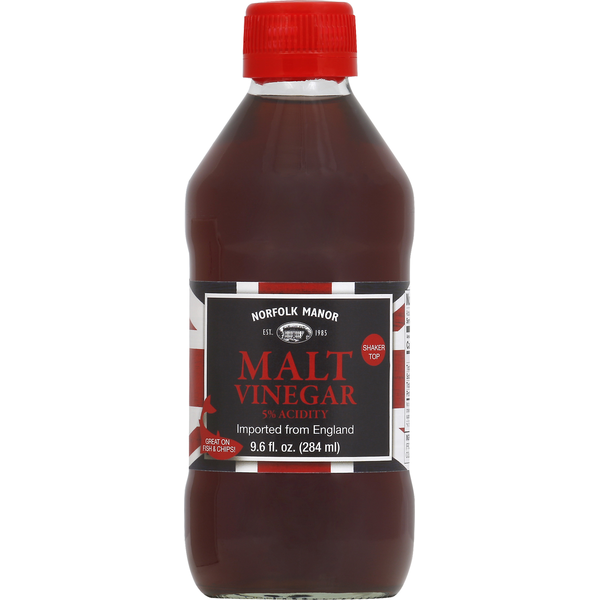
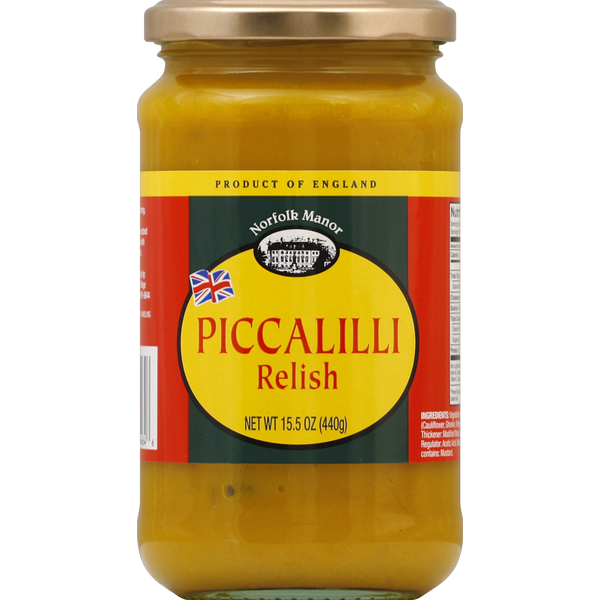
Sold at
Where to find Norfolk Manor · Bay Area
2 storefronts across 2 grocers carry it · tap a pin to open the store.