Bay Area · 13 grocers · Contested🌡️ heat 54 · WARM
the ice creams aisle
Bay Area's ice creams aisle is a fragmented shelf spread across many brands: 52 products from 18 brands across 13 grocers. Store brands hold 13%. Verdict: contested · real competition, no single winner (opportunity 65/100).
52
products
18
brands
$10.71
avg price
$0.35-$0.90 /fl oz
typical range
More in Ice Cream
Who owns the shelf
brands by share of the ice creams shelf.
Brand positioning
every brand by share of shelf × price. bubble size = the brand's total reach across all aisles; color = positioning stance. top-right owns the premium end; bottom-right owns the mainstream.
All stores combined.
Market structure
63
medBrand competition
how many brands compete
62
medVariety of offers
how differentiated the shelf is
9
lowTop-brand grip
how much a few brands dominate
65
medLaunch whitespace
room for a new brand
store-brand share: 13% · scores 0-100.
Top products
the ice creams products in the most Bay Area grocers · widest distribution first.
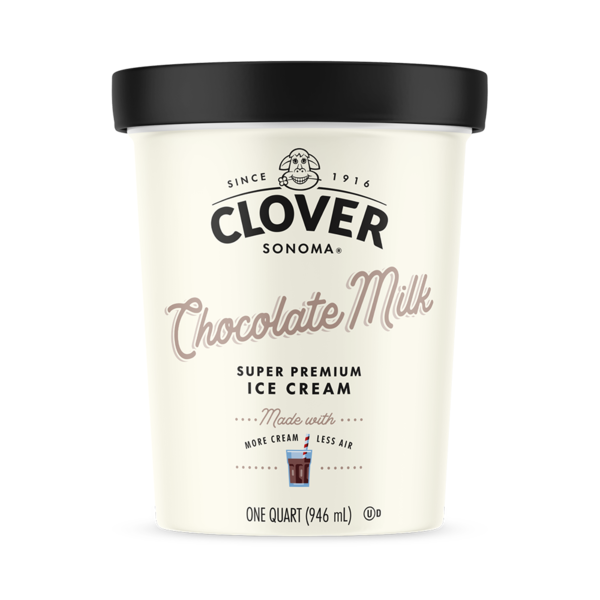
Clover Sonoma Super Premium Ice Cream Chocolate Milk
$7.797 grocers
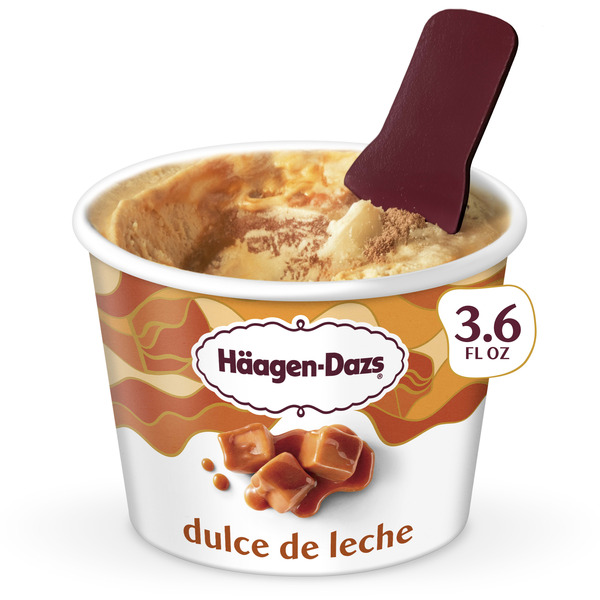
Häagen-Dazs Dulce De Leche Ice Cream Cup
$1.996 grocers
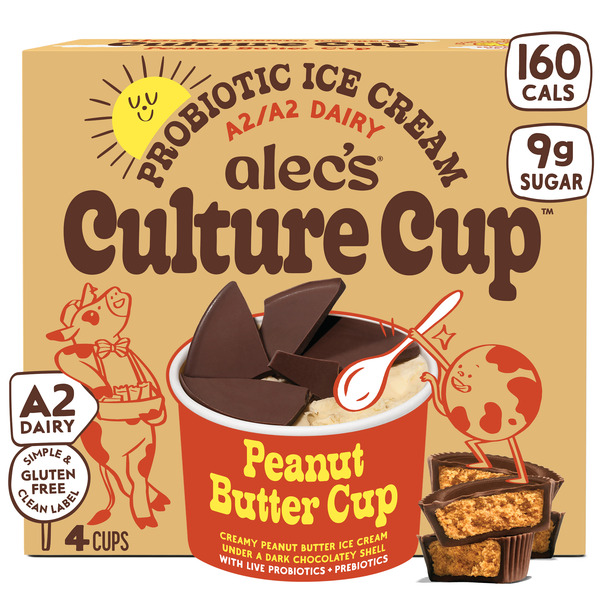
alec's ice cream Culture Cup, Peanut Butter Cup, A2 Dairy
$8.795 grocers
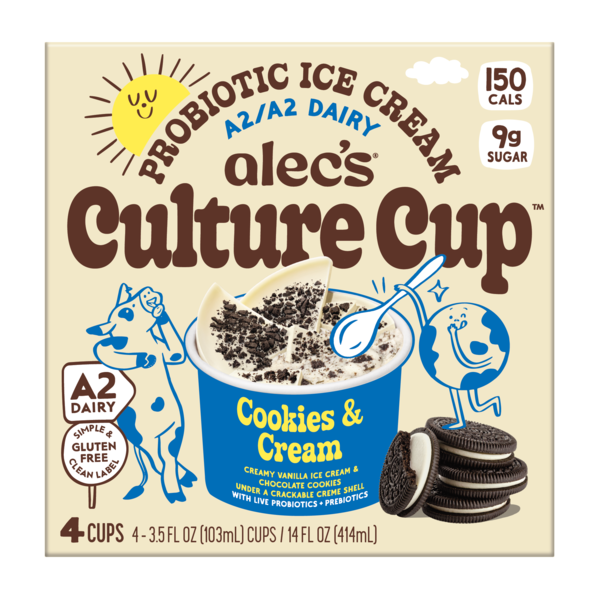
alec's ice cream Culture Cup, Cookies & Cream, A2 Dairy
$8.093 grocers
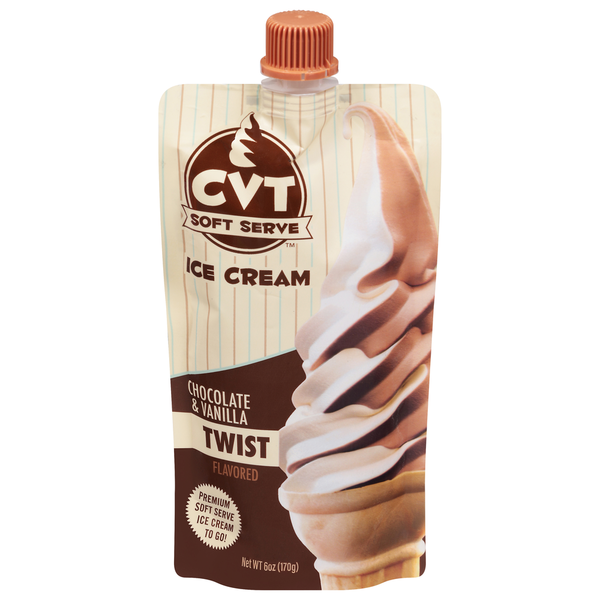
CVT Soft Serve Chocolate & Vanilla Twist Flavored Ice Cream
$2.992 grocers
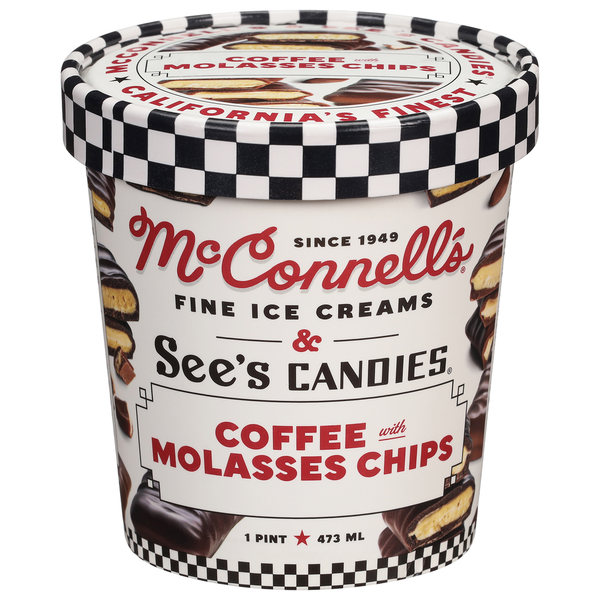
McConnell’s Coffee with Molasses Chips Ice Cream
$12.192 grocers
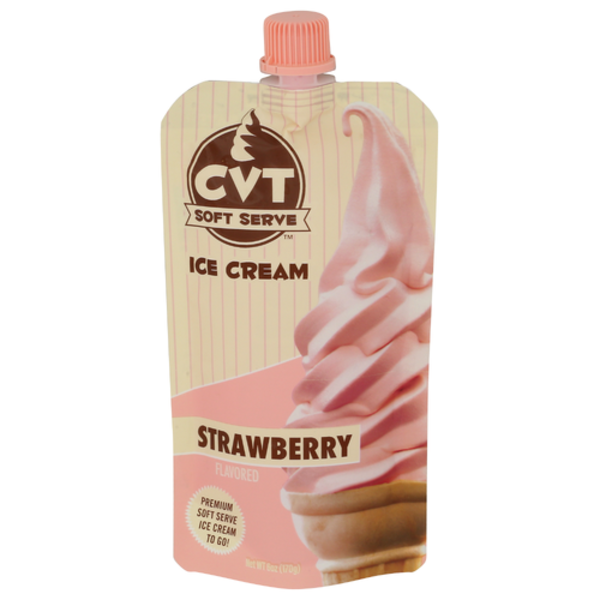
Cvt Soft Serve Strawberry Soft Serve Ice Cream
$2.991 grocer
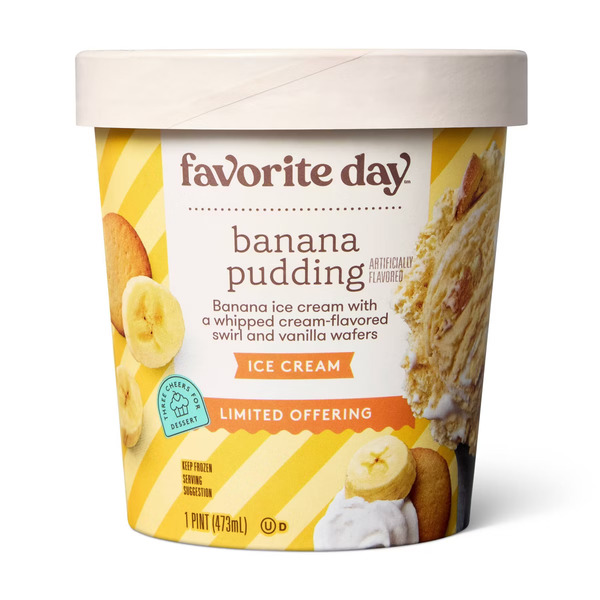
Favorite Day Banana Pudding Ice Cream
$2.991 grocer
no image
Neapolitan Ice Cream
$3.391 grocer
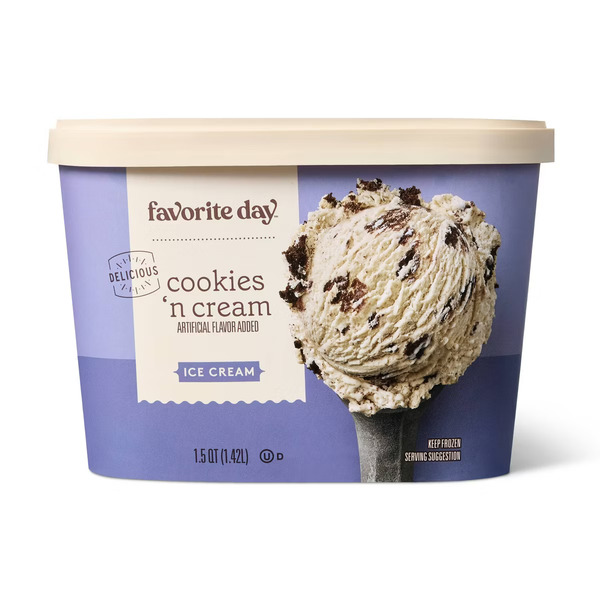
Favorite Day Cookies N' Cream Ice Cream
$3.991 grocer