berkeley bowl
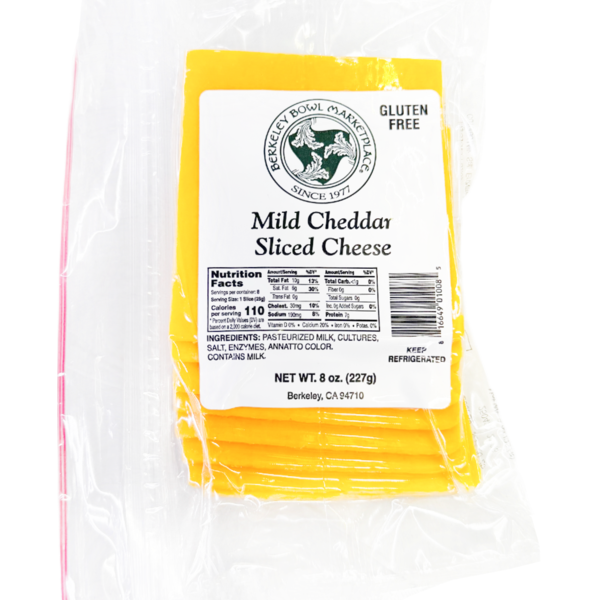
Berkeley Bowl is Berkeley Bowl's own private-label line · 335 products across 53 categories, sold in its own stores. It's a leading brand in prepared sandwiches, holding 22% of that shelf. A mid-tier presence · Brand Power 52/100.
Berkeley Bowl is playing a niche game with a sprawling assortment that covers a wide range of categories, from prepared meals and sandwiches to seafood and nuts. Despite its broad product portfolio, the brand is only present in a single grocery door, indicating a highly localized reach. Positioned below most of its category rivals in price, Berkeley Bowl does not aim for the premium segment but rather offers a more accessible option with a conventional-indulgent lineup, as only a small fraction of its products highlight better-for-you attributes. In the prepared meals aisle, it faces stiff competition from larger players like Amy's Kitchen and Stouffer's, but it carves out its own space with unique offerings such as alternative meat entrees and ethnic-inspired dishes like banh mi and pho broth.
Shelf presence
Brand Power (0-100) blends four shelf signals. Price position is shown below for context · a value↔premium read, not part of the score.
Store brand. Berkeley Bowl is exclusive to Berkeley Bowl by design, so Distribution · and therefore Brand Power · reads low next to national brands. Judge it against other store brands, not the shelf leaders.
exclusive to Berkeley Bowl. store brands sell in one chain by design, which caps this.
335 products in the catalog. how deep the product line is (saturating).
Where it owns shelf
each bar is the % of that category's SKUs that are Berkeley Bowl (full bar = 100% of the shelf), grouped by department.
Top competitors
the brands crowding the same categories as Berkeley Bowl · photographed shelf-mates first, then brands stocked beside it at the same grocers, then same-category rivals citywide.
The lineup
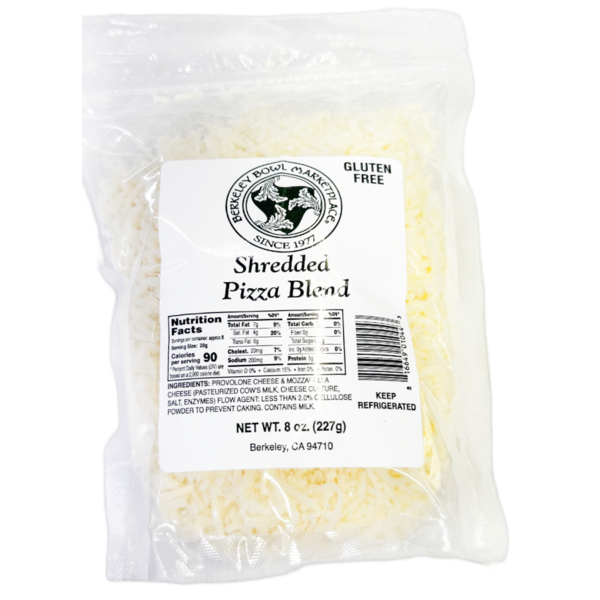
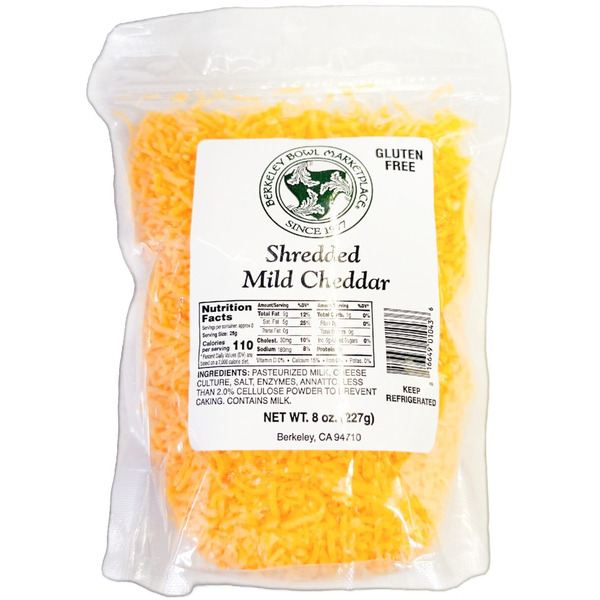
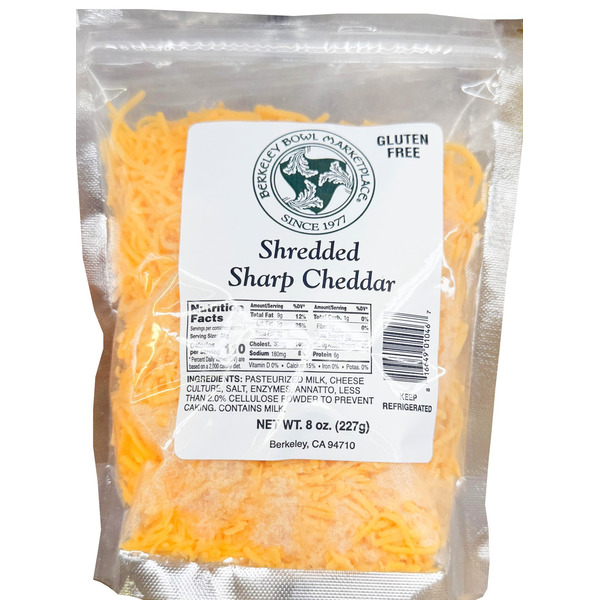
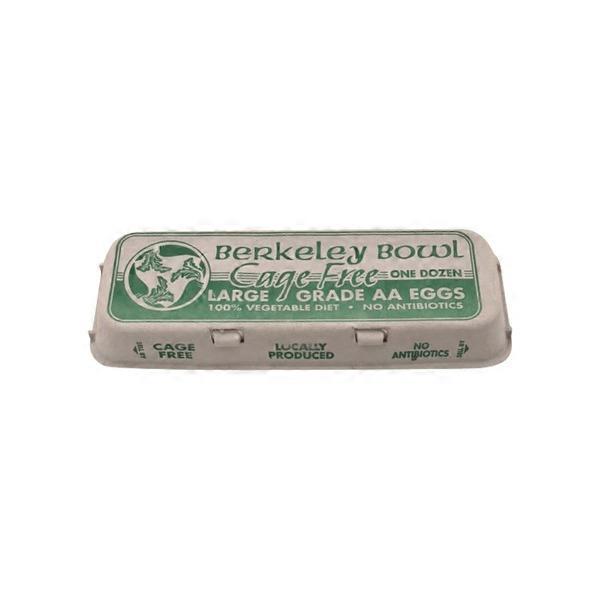
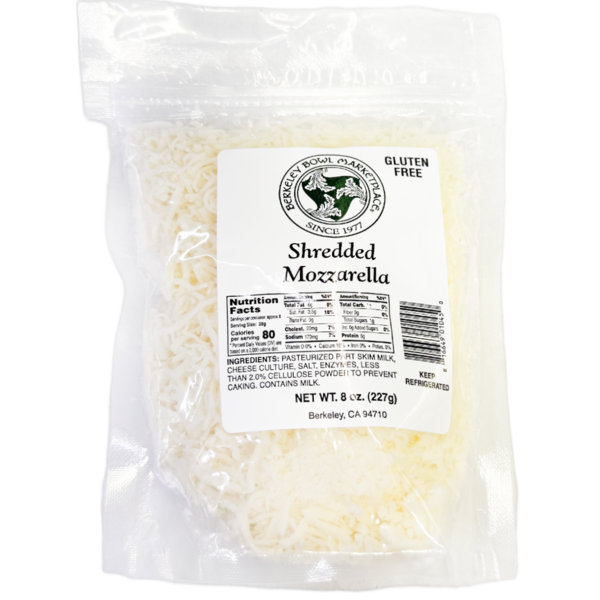
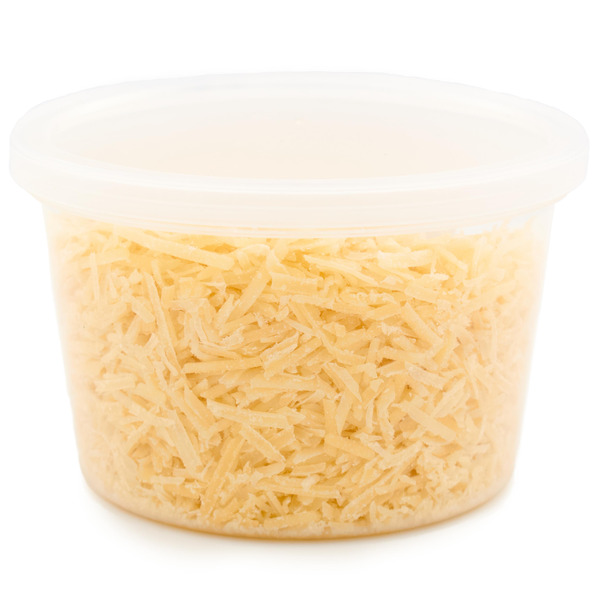
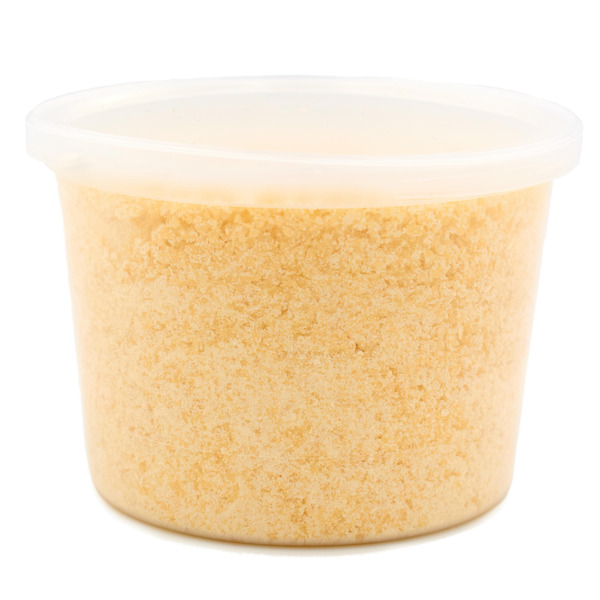
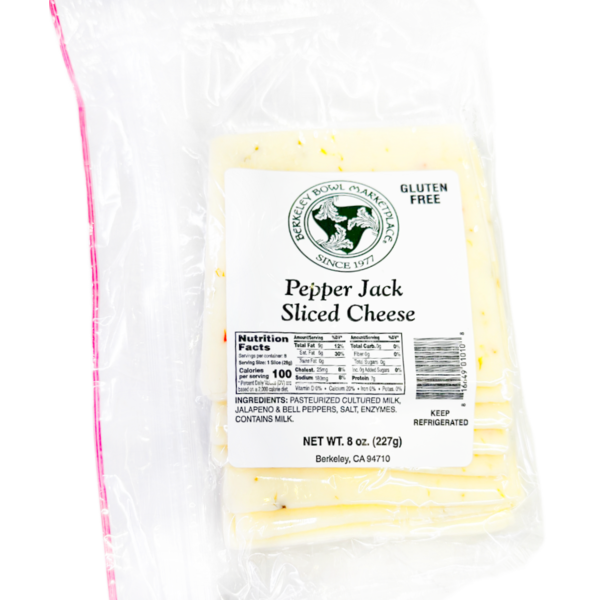
every Berkeley Bowl product in stock, cheapest first.
Sold at
Where to find Berkeley Bowl · Bay Area
10 storefronts across 3 grocers carry it · tap a pin to open the store.


