Bay Area · 19 grocers · Contested
the frozen fruit aisle
Bay Area's frozen fruit aisle is a fragmented shelf spread across many brands: 188 products from 23 brands across 19 grocers. wyman's owns the most shelf · 50% of SKUs, ahead of seal the seasons. Store brands hold 15%. The shelf leans vegan · 8% of SKUs carry that claim. Verdict: contested · real competition, no single winner (opportunity 61/100).
188
products
23
brands
$11.52
avg price
$0.39-$1.15 /oz
typical range
More in Frozen Meat & Produce
Who owns the shelf
brands by share of the frozen fruit shelf.
Brand positioning
every brand by share of shelf × price. bubble size = the brand's total reach across all aisles; color = positioning stance. top-right owns the premium end; bottom-right owns the mainstream.
scale
Color:indulgentbetter-for-you
Size:total brand reach (SKUs across all aisles)
price normalized per oz (sizes vary)1 omitted (no oz size)All stores combined.
Market structure
72
highBrand competition
how many brands compete
87
highVariety of offers
how differentiated the shelf is
9
lowTop-brand grip
how much a few brands dominate
61
medLaunch whitespace
room for a new brand
store-brand share: 15% · scores 0-100.
Top products
the frozen fruit products in the most Bay Area grocers · widest distribution first.
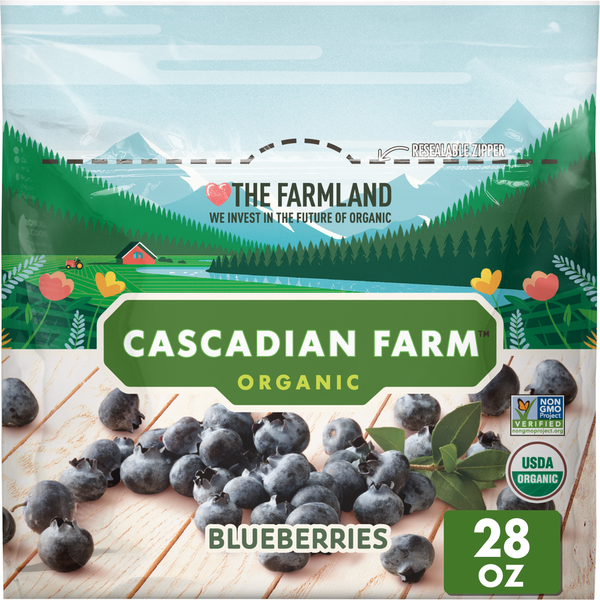
Cascadian Farm Organic Frozen Blueberries
$5.499 grocers
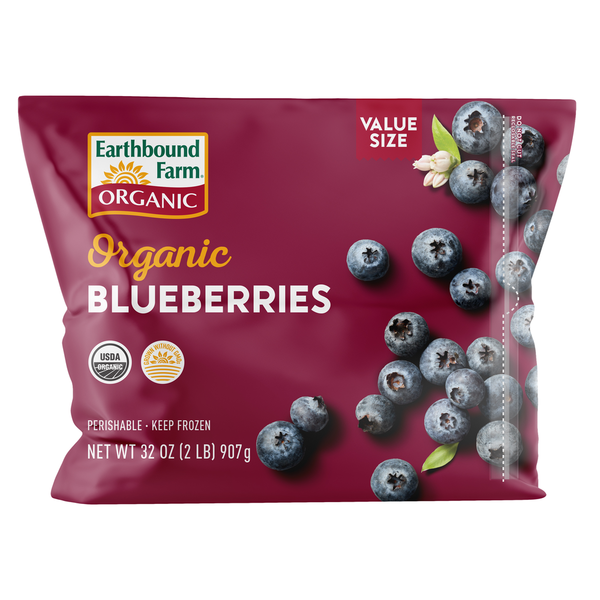
Earthbound Farm Blueberries, Organic, Value Size
$5.898 grocers
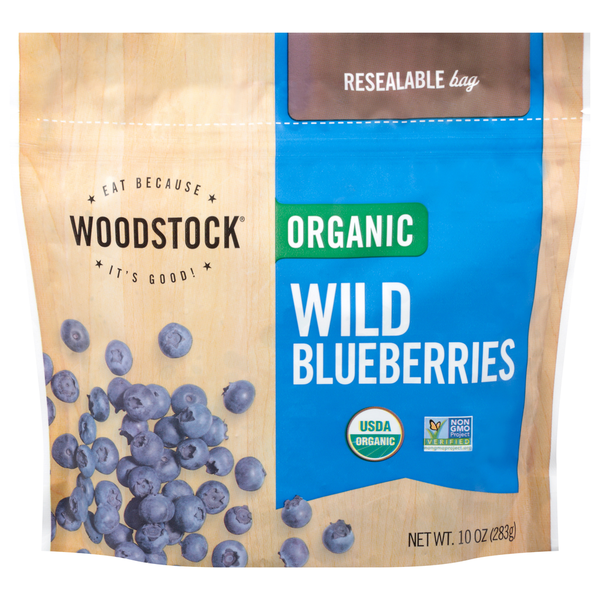
WOODSTOCK Organic Wild Blueberries
$8.798 grocers

Wyman's Wild Blueberries
$16.997 grocers
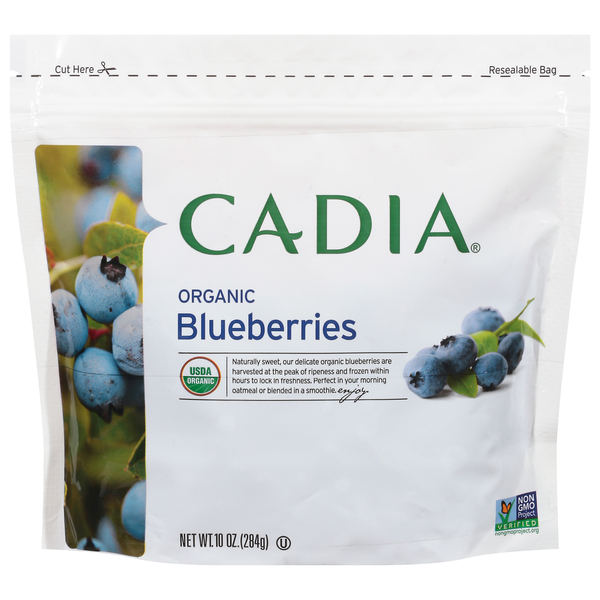
CADIA Blueberries, Organic
$3.596 grocers
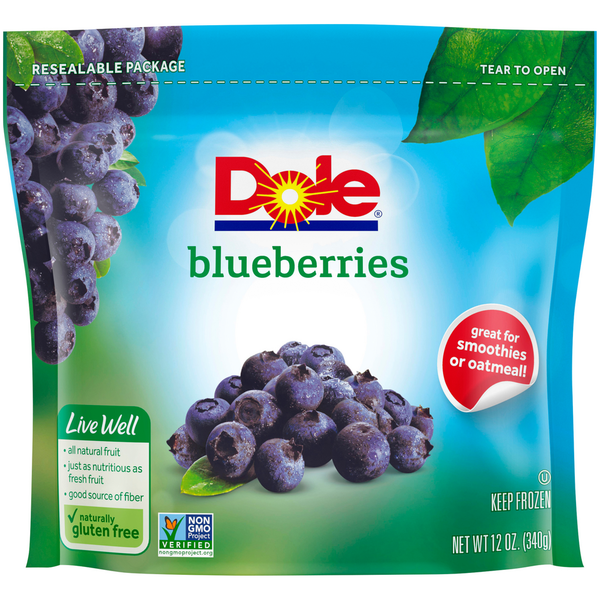
Dole Blueberries
$6.396 grocers

WOODSTOCK Organic Mixed Berries
$7.696 grocers
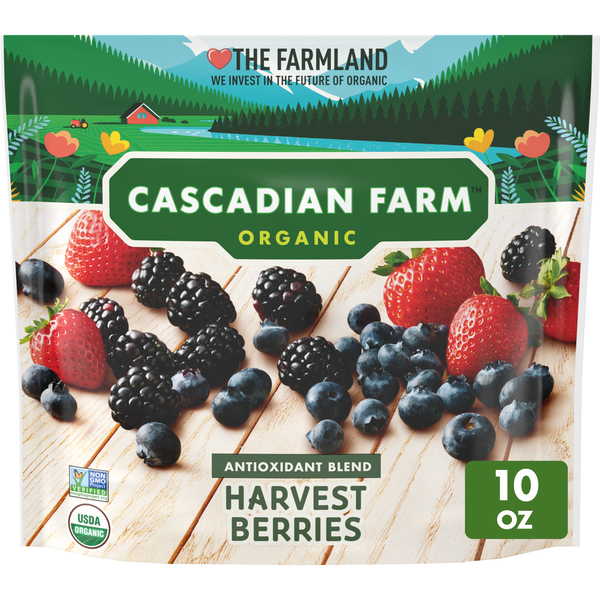
Cascadian Farm Organic Antioxidant Blend Frozen Harvest Berries
$7.796 grocers

Earthbound Farm Berry Basket Blend, Organic
$5.895 grocers
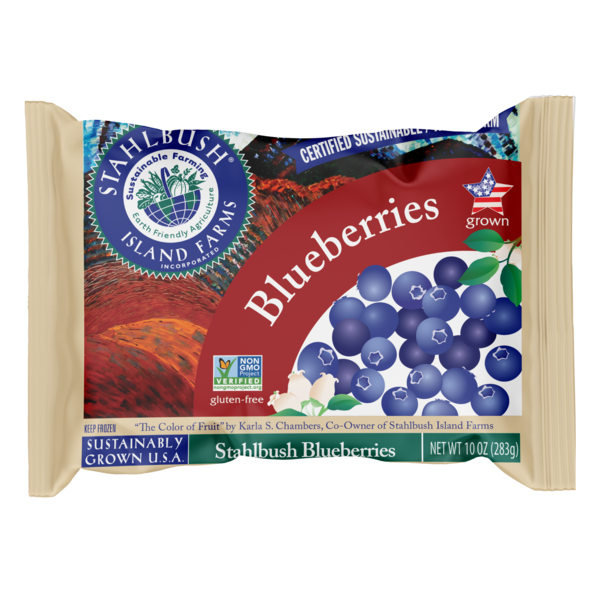
Stahlbush Island Farms Blueberries
$6.695 grocers