Bay Area · 7 grocers · Contested🔥 heat 75 · HOT
the lamb aisle
Bay Area's lamb aisle is a competitive shelf with clear leaders: 18 products from 7 brands across 7 grocers. new zealand lamb owns the most shelf · 50% of SKUs, ahead of atkins ranch. Store brands hold 33%. Verdict: contested · real competition, no single winner (opportunity 69/100).
18
products
7
brands
$25.01
avg price
$1.01-$1.34 /oz
typical range
Zoom in
this aisle breaks into 6 sub-categories · open one for its own shelf report.
Who owns the shelf
brands by share of the lamb shelf.
How it's positioned
the claims products on this shelf lead with · share of SKUs carrying each.
no positioning claims tagged on this shelf yet.
Market structure
32
lowBrand competition
how many brands compete
43
medVariety of offers
how differentiated the shelf is
20
lowTop-brand grip
how much a few brands dominate
69
highLaunch whitespace
room for a new brand
store-brand share: 33% · scores 0-100.
Top products
the lamb products in the most Bay Area grocers · widest distribution first.
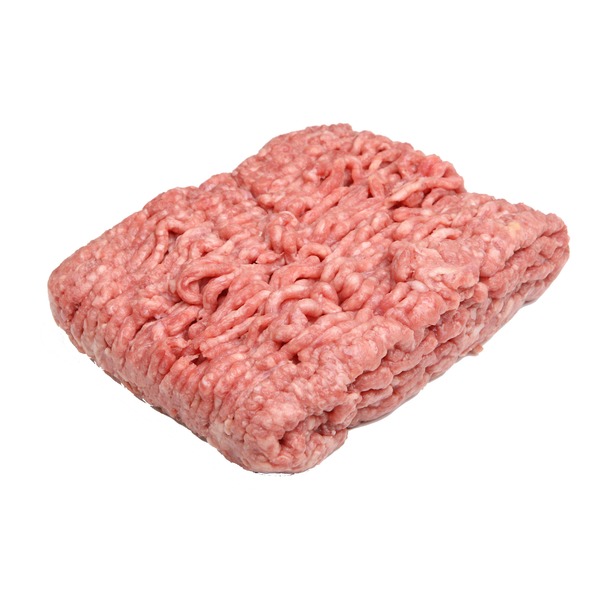
Niman Ranch Ground Lamb
$17.592 grocers
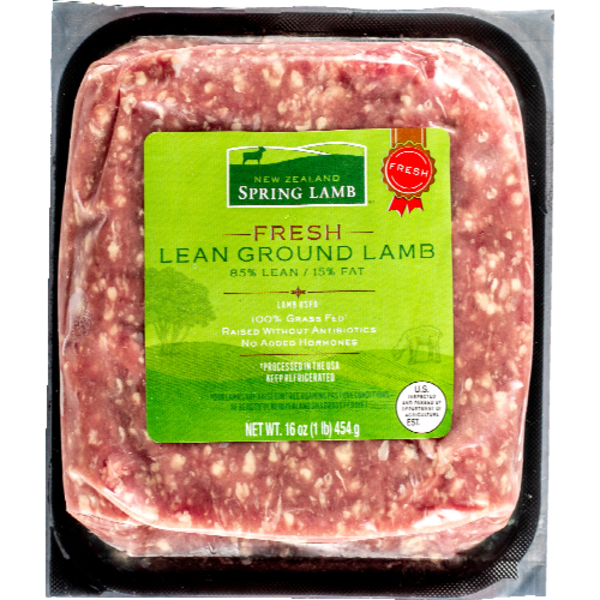
New Zealand Lamb Ground Lamb 85/15
$11.991 grocer
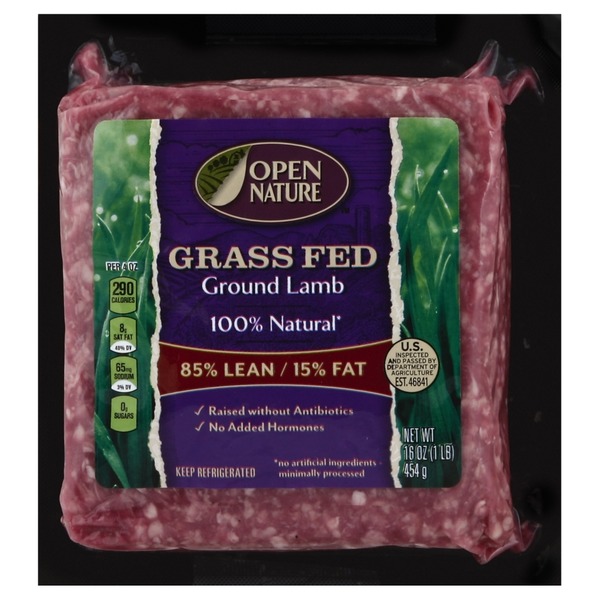
Open Nature Ground Lamb
$14.991 grocer
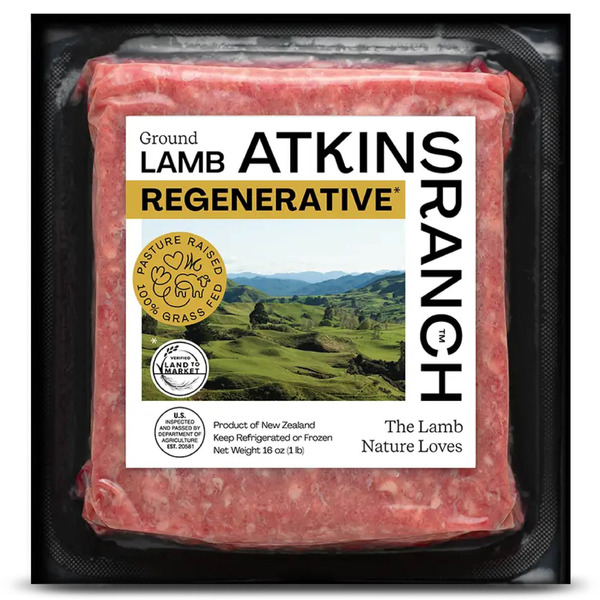
Atkins Ranch Regenerative Ground Lamb
$16.091 grocer
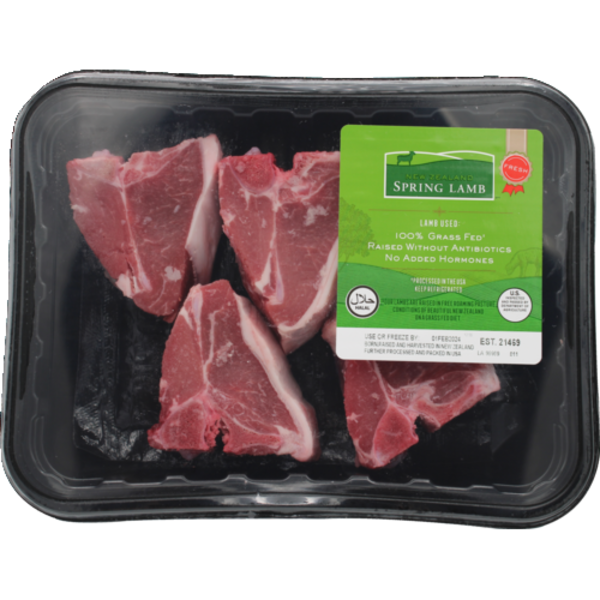
New Zealand Lamb Lamb Loin Chop
$16.141 grocer
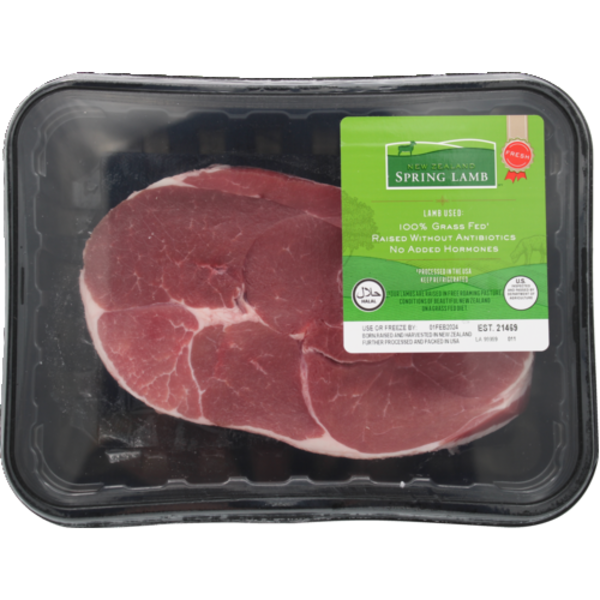
New Zealand Lamb Lamb Boneless Leg Steak
$16.991 grocer
no image
Stemple Creek Ranch Ground Lamb
$17.691 grocer
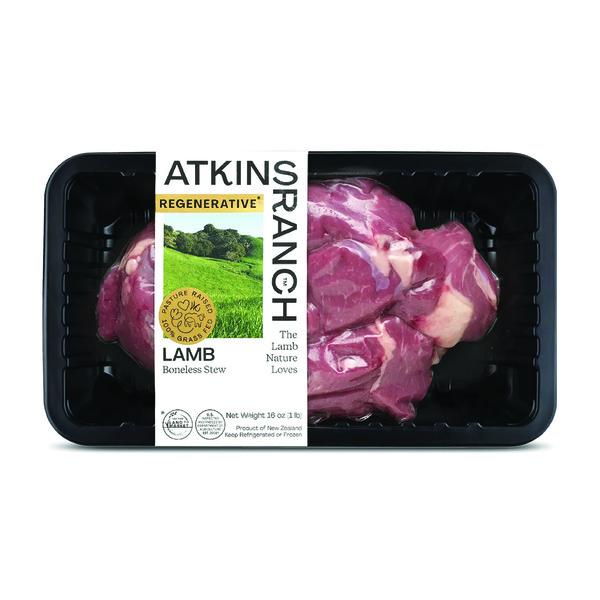
Atkins Ranch Regenerative Lamb Boneless Stew
$21.391 grocer
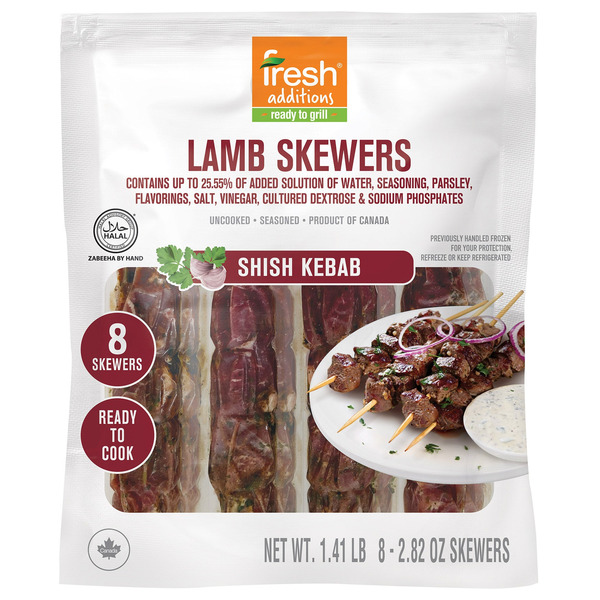
Fresh Additions Halal Lamb Skewers, 2.82 oz, 8-count
$24.871 grocer
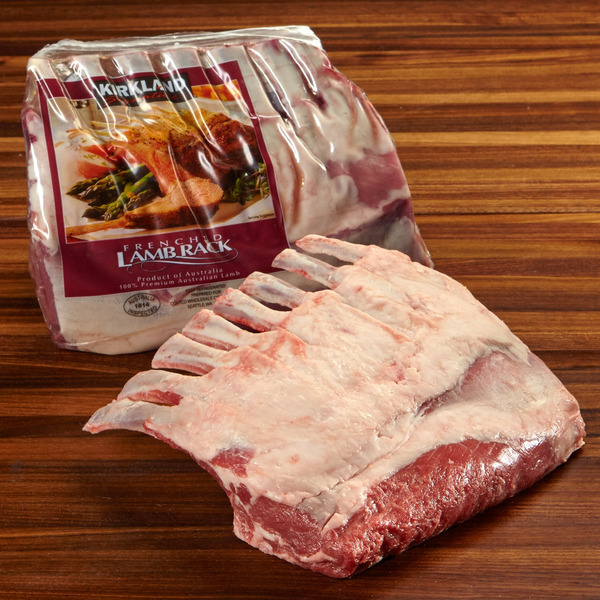
Kirkland Signature Frenched Lamb Rack
$31.711 grocer