Bay Area · 21 grocers · Fragmented🌡️ heat 39 · WARM
the peanuts aisle
Bay Area's peanuts aisle is a fragmented shelf spread across many brands: 208 products from 28 brands across 21 grocers. planters owns the most shelf · 30% of SKUs, ahead of feridies. Store brands hold 15%. Verdict: fragmented · a crowded free-for-all with no clear structure (opportunity 65/100).
208
products
28
brands
$7.63
avg price
$0.28-$1.67 /oz
typical range
More in Nuts
Who owns the shelf
brands by share of the peanuts shelf.
Brand positioning
every brand by share of shelf × price. bubble size = the brand's total reach across all aisles; color = positioning stance. top-right owns the premium end; bottom-right owns the mainstream.
scale
Color:indulgentbetter-for-you
Size:total brand reach (SKUs across all aisles)
Shape:nationalstore brand
price normalized per oz (sizes vary)2 omitted (no oz size)1 omitted (no image)All stores combined.
Market structure
79
highBrand competition
how many brands compete
48
medVariety of offers
how differentiated the shelf is
12
lowTop-brand grip
how much a few brands dominate
65
medLaunch whitespace
room for a new brand
store-brand share: 15% · scores 0-100.
Top products
the peanuts products in the most Bay Area grocers · widest distribution first.
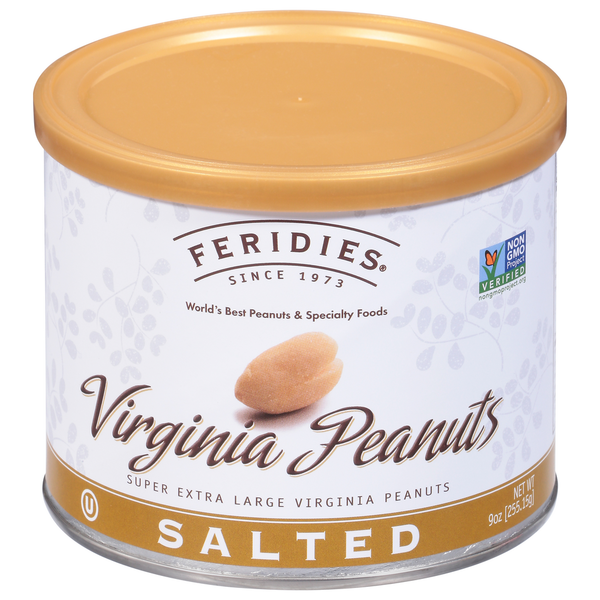
FERIDIES Virginia Peanuts, Salted, Super Extra Large
$7.9911 grocers
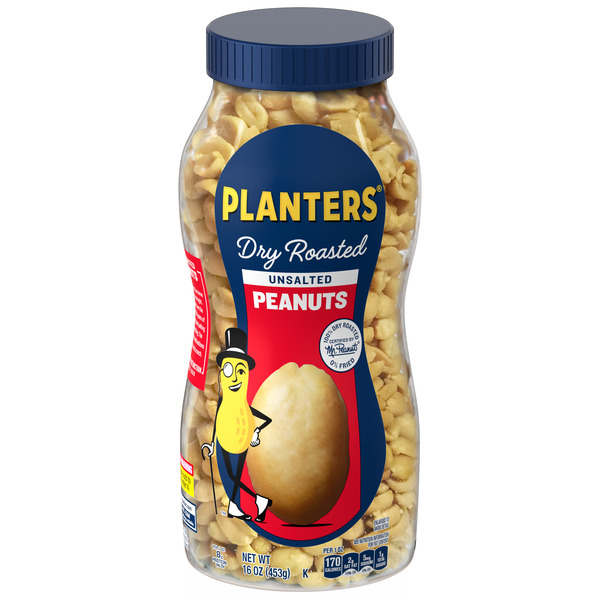
Planters Dry Roast Unsalted Peanuts, 16 OZ
$3.469 grocers
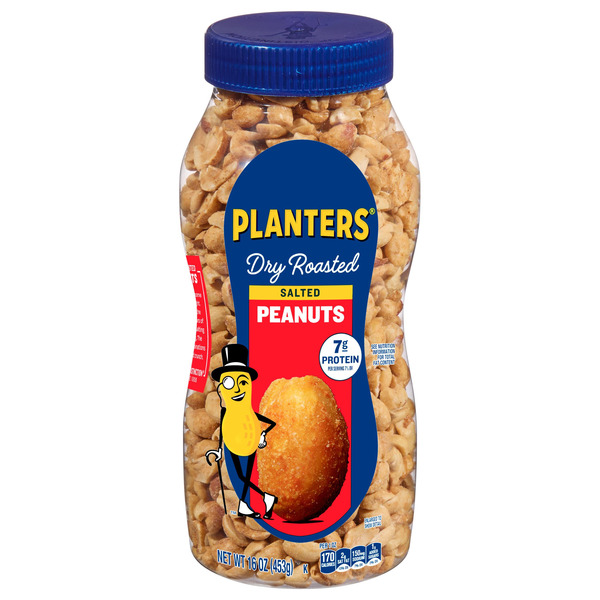
Planters Salted Dry Roasted Peanuts
$3.499 grocers
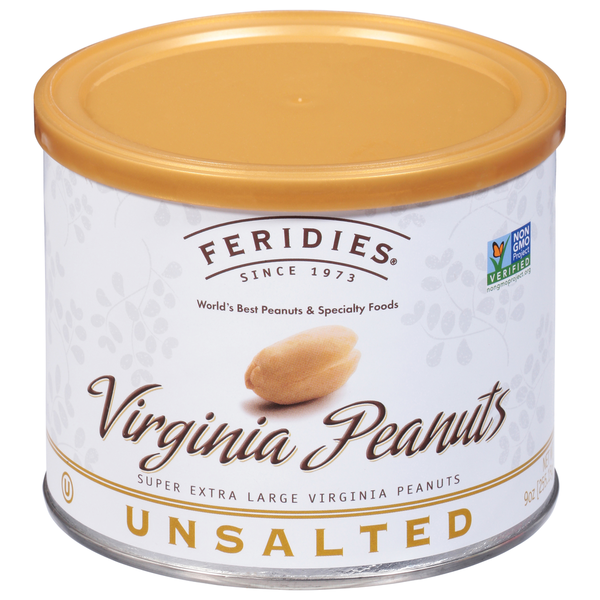
FERIDIES Virginia Peanuts, Unsalted, Super Extra Large
$7.999 grocers
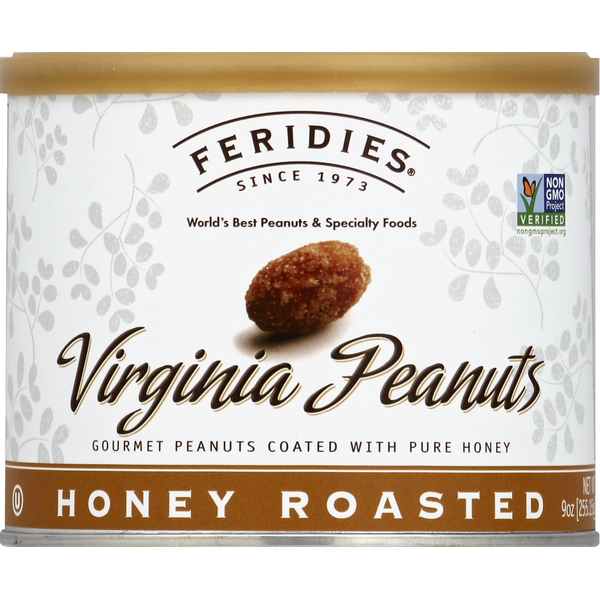
FERIDIES Peanuts, Virginia, Honey Roasted
$11.098 grocers
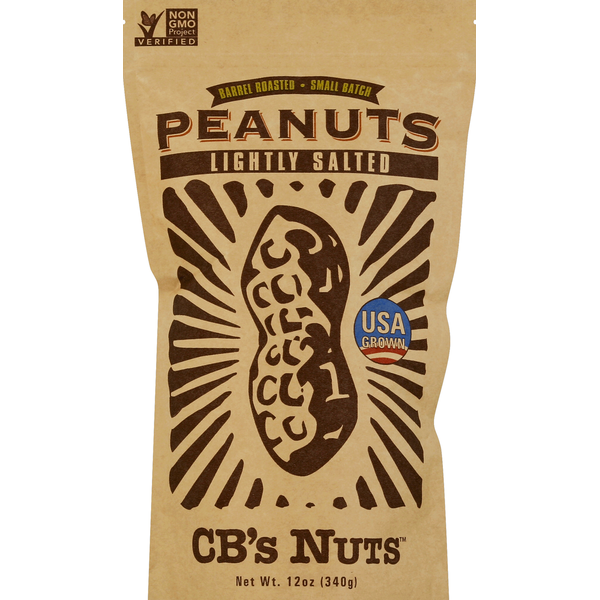
CBs Nuts Peanuts, Lightly Salted
$5.997 grocers
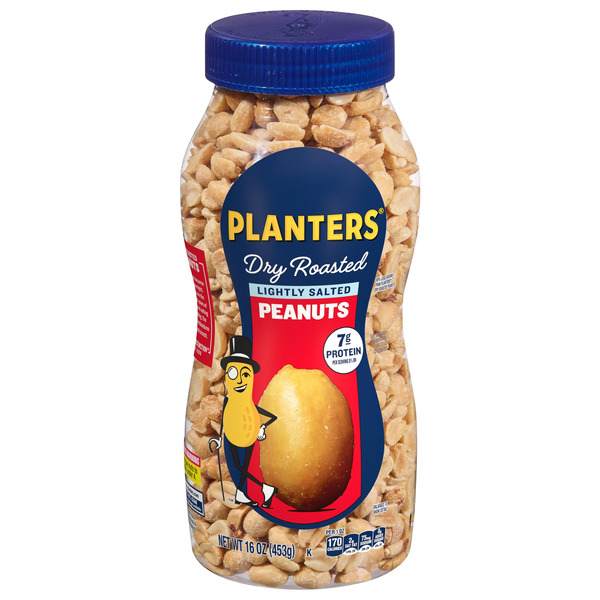
Planters Lightly Salted Dry Roast Peanuts, 16 OZ
$3.466 grocers
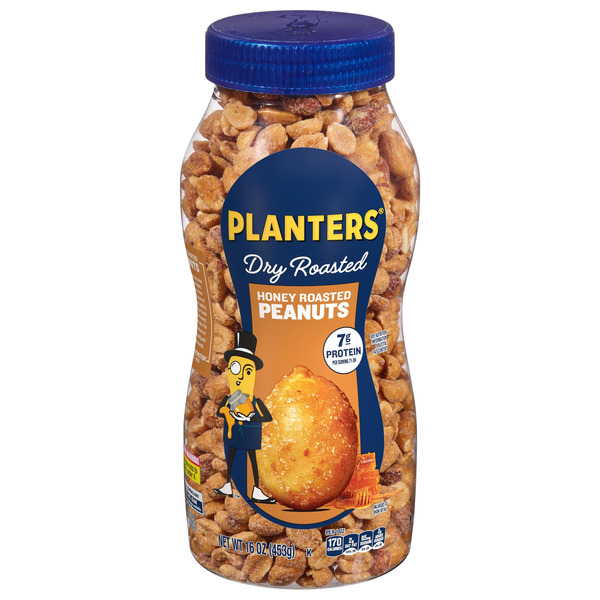
Planters Honey Roasted Peanuts
$5.895 grocers
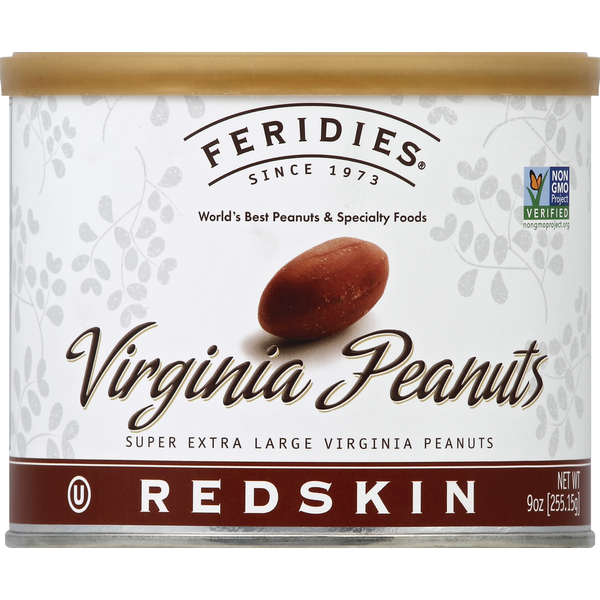
FERIDIES Peanuts, Virginia, Redskin
$8.795 grocers
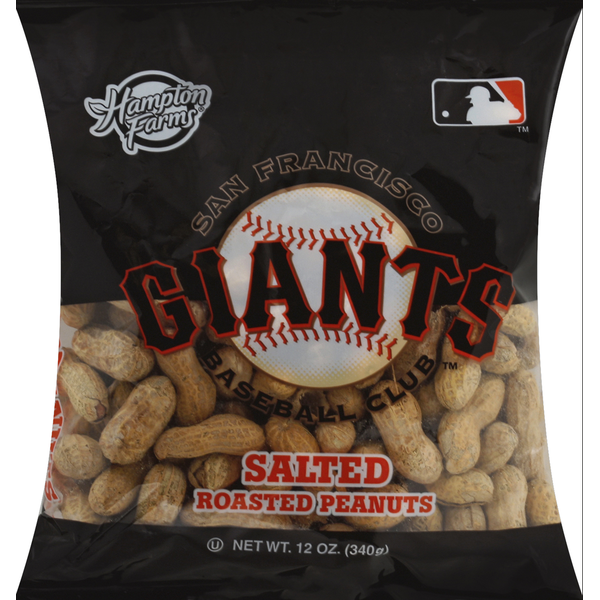
Hampton Farms Peanuts, Roasted, Salted
$2.994 grocers