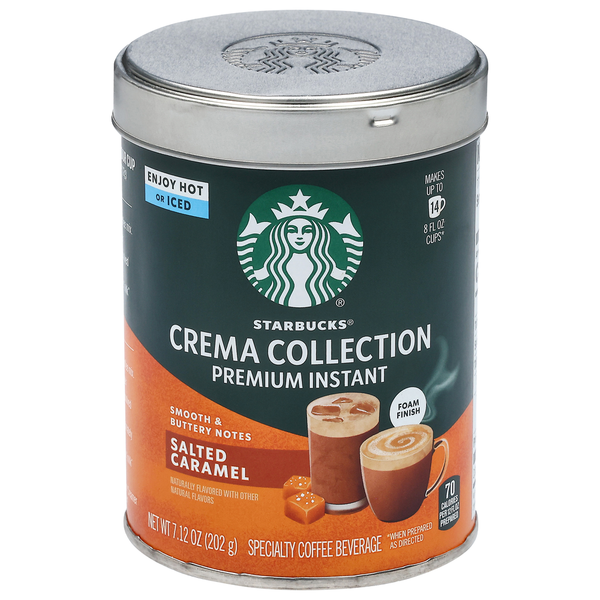
Nescafe vs Starbucks · Bay Area shelf head-to-head
Nescafe and Starbucks, side by side on Bay Area’s shelves · same instruments, same day, no sponsorship.
Brand Power, component by component
the same four weighted signals scored on both brands’ own pages.
carried in 10 of 24 Bay Area grocers·carried in 13 of 24 Bay Area grocers
Contested categories
categories both brands play in · each bar is that brand’s share of the category’s SKUs citywide.
only Nescafe
no top category Starbucks doesn’t also play in.
Doors
who stocks each brand right now · shared, and each brand’s exclusive doors.
no exclusive doors — everywhere Nescafe is, Starbucks is too.
Head to head
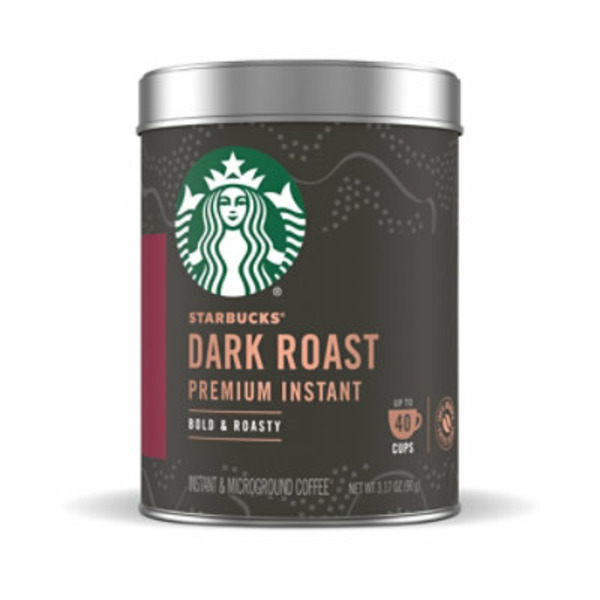
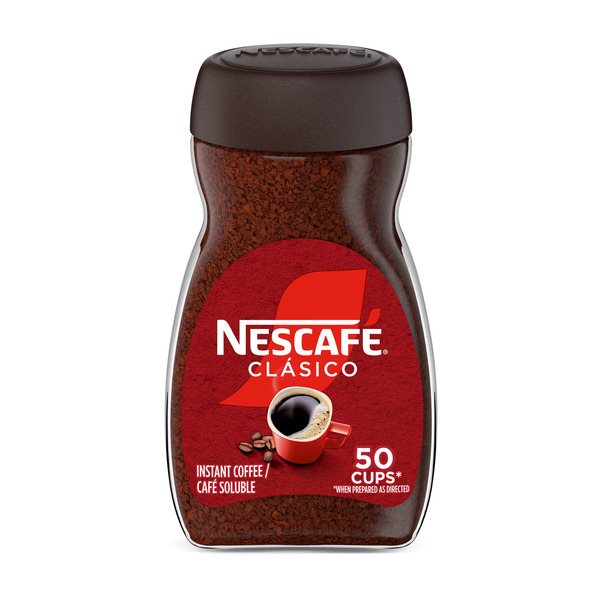
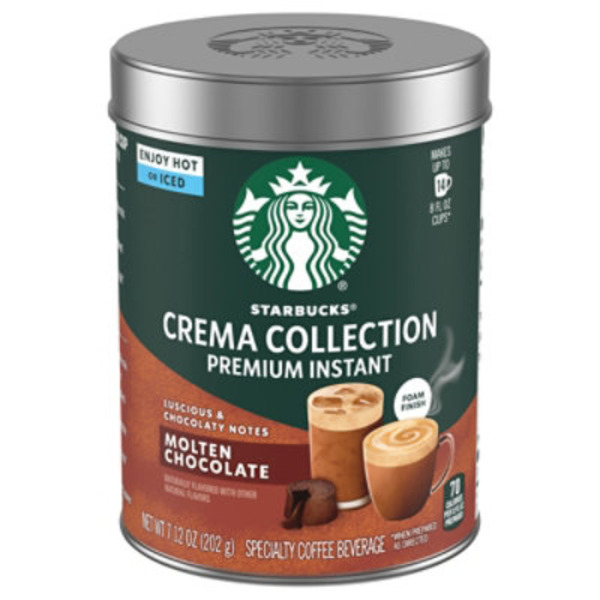
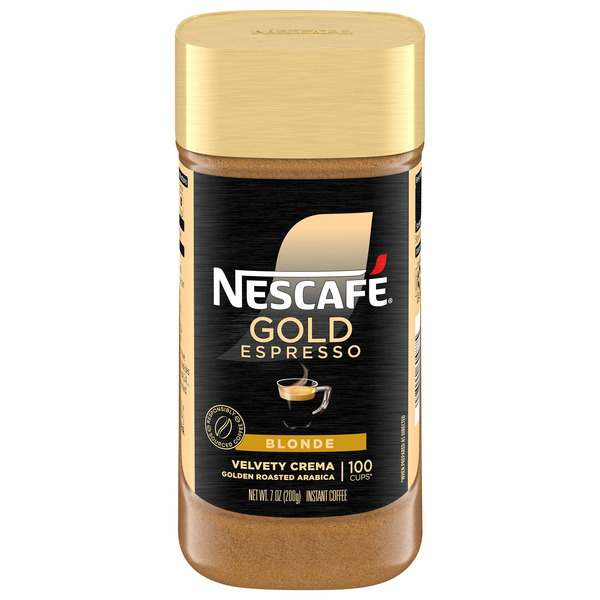
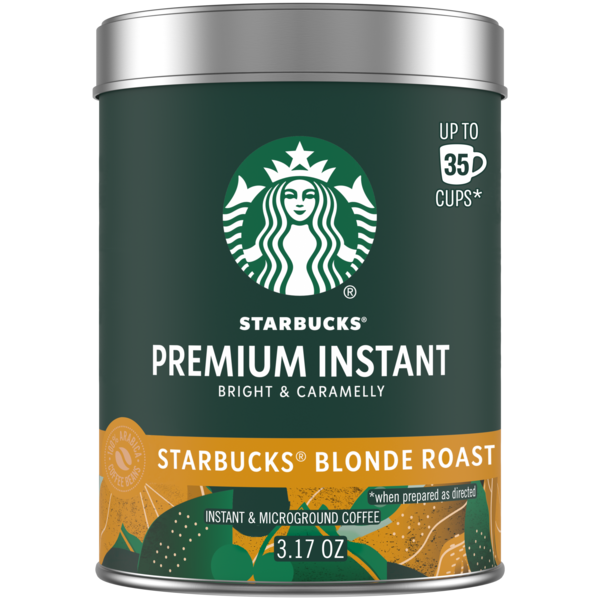
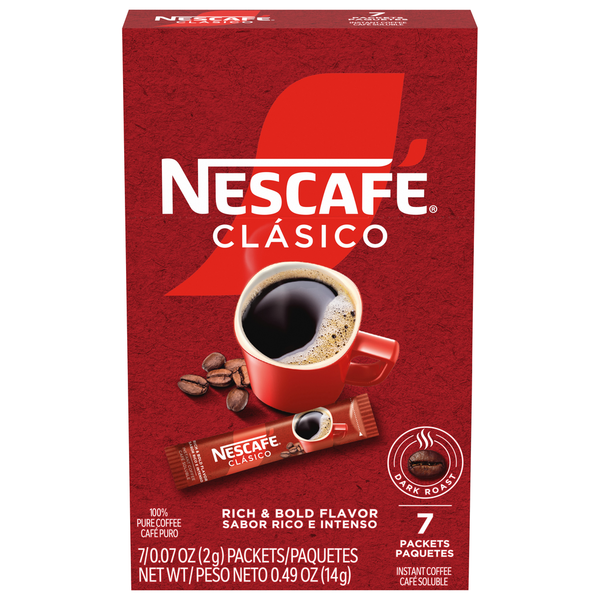
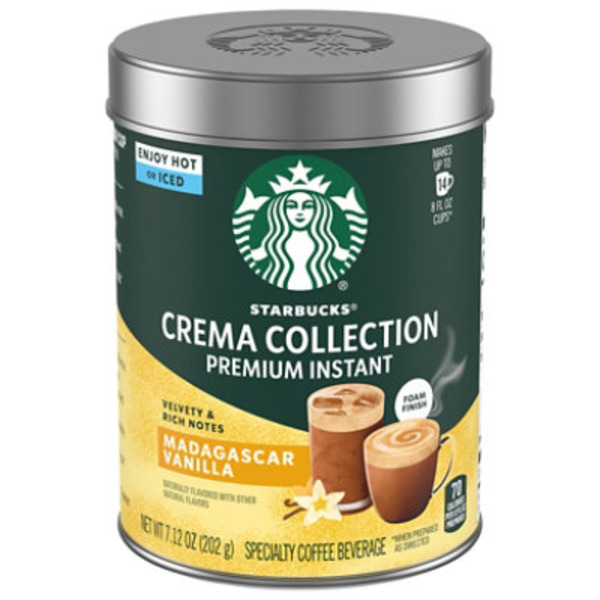
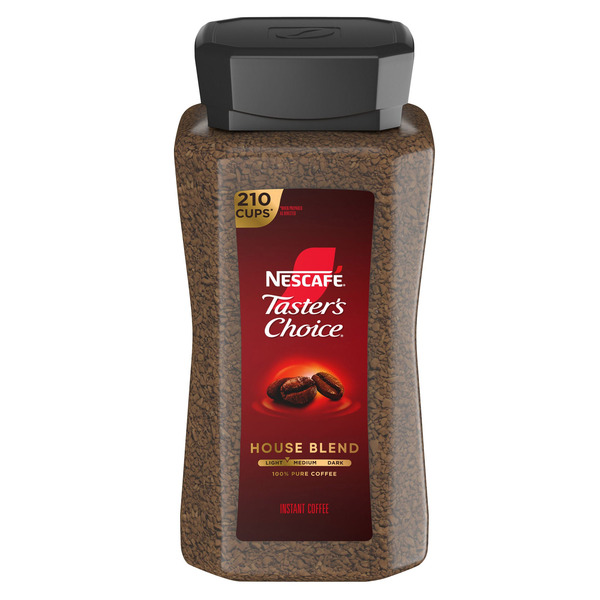
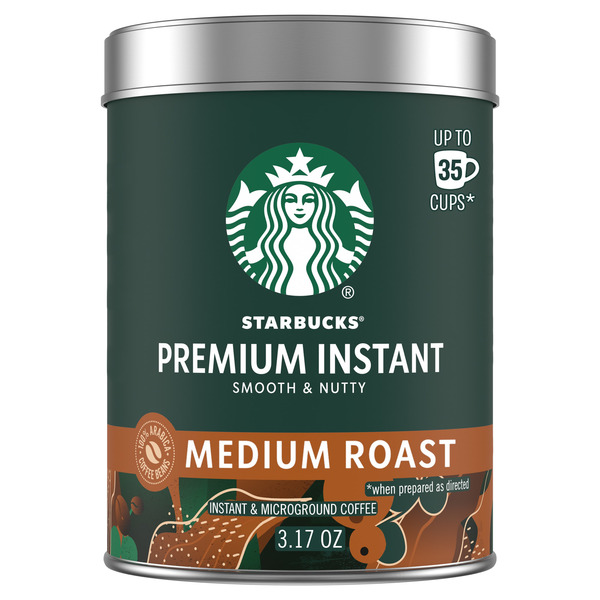
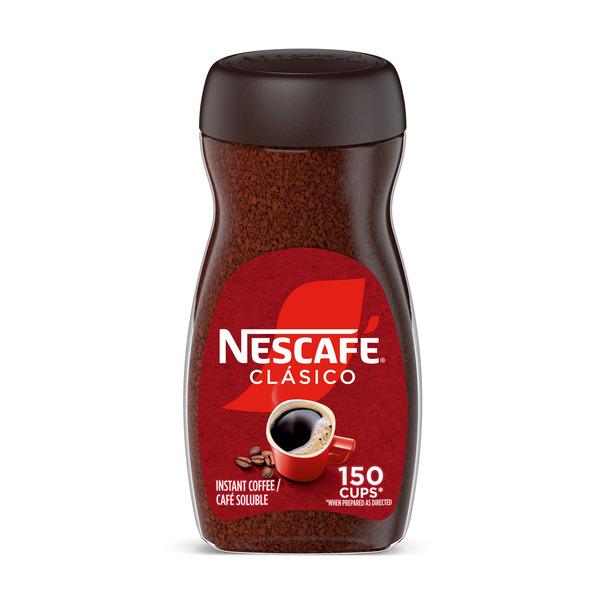
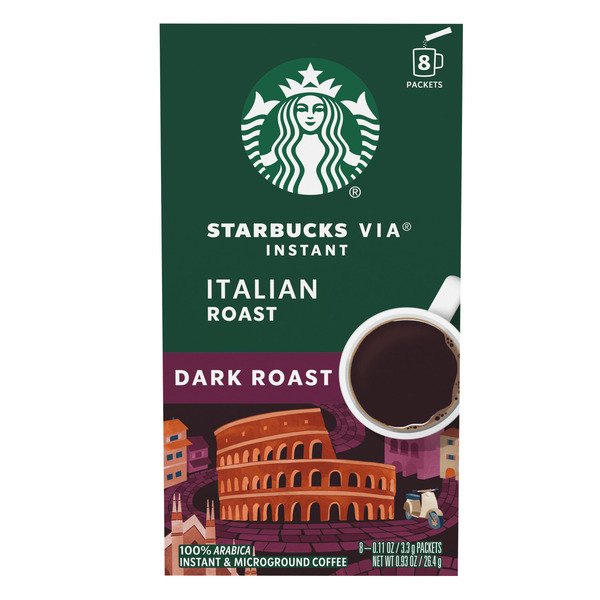
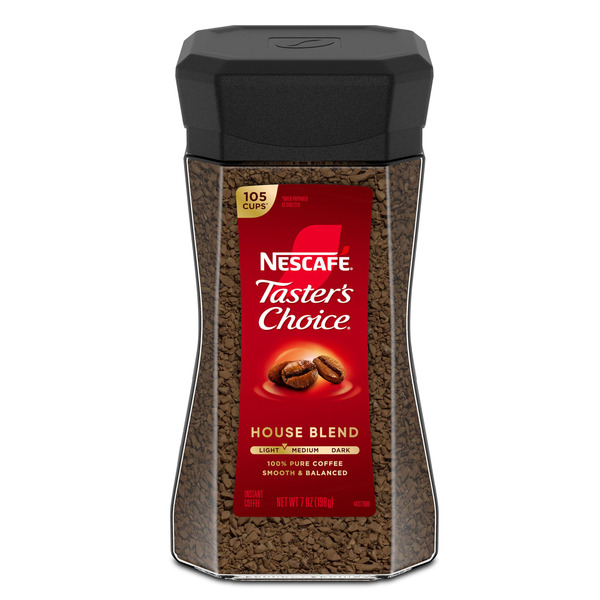
each brand’s closest counterpart to the other’s, matched on what the product is (name, category, description) · not price.
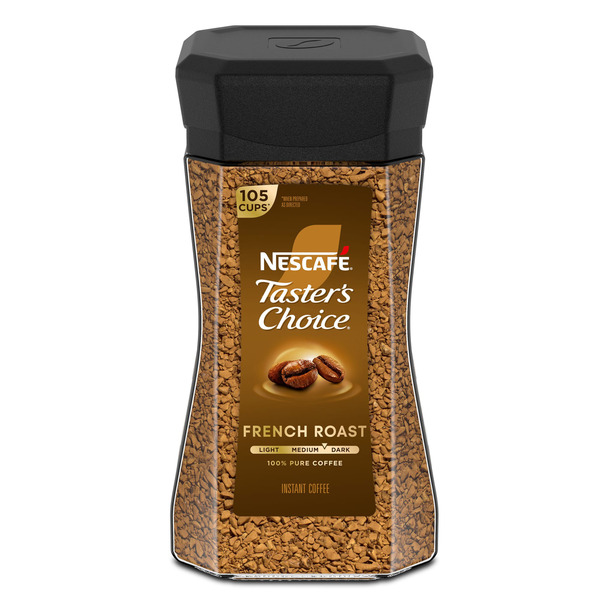
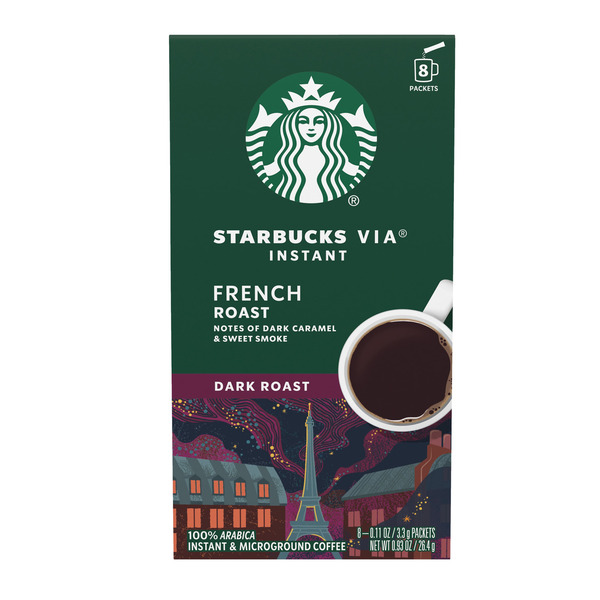
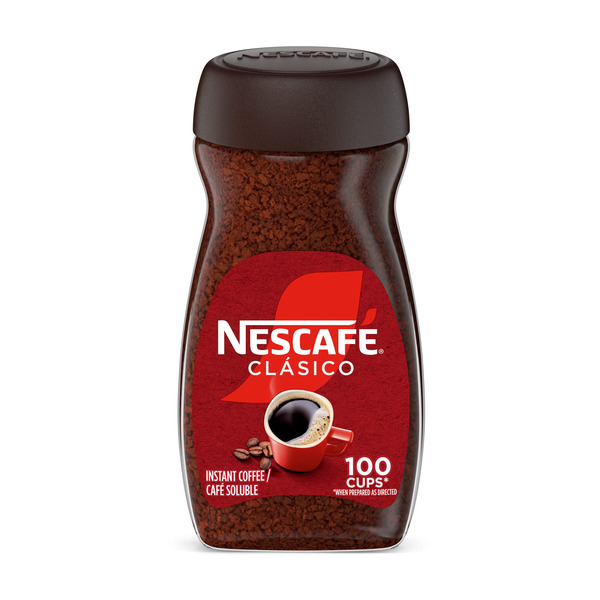
both sides measured by the same instruments on the same shelves · see each brand’s full page: Nescafe · Starbucks