Whole Foods Market
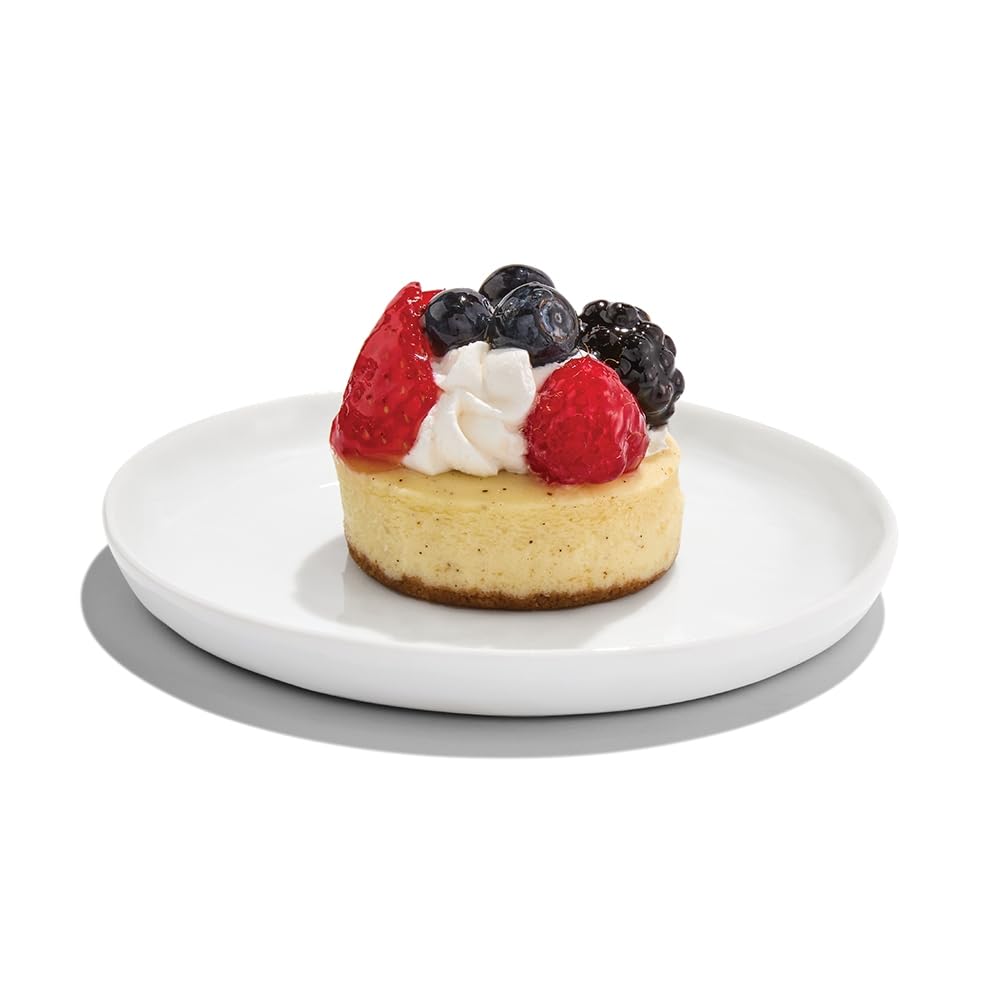
Whole Foods Market is a grocery brand known for its high-quality meat and seafood, as well as its breads and bakery items. The brand emphasizes the use of better ingredients, with a commitment to banning over 240 undesirable ingredients from its products. Whole Foods Market is particularly renowned for its Berry Chantilly Cake and offers a variety of sustainably sourced seafood options.
Whole Foods Market is playing a single-door strategy, with its products exclusively available at one retailer among the 15 tracked, which suggests a focus on a captive audience rather than broad market penetration. The brand's portfolio is a sprawling array with a notable emphasis on Breads & Bakery, where it commands a dominant share, overshadowing even its own sub-brand, 365 by Whole Foods Market. Despite the wide variety, none of the products carry better-for-you dietary claims, positioning the brand as a conventional indulgent choice rather than a health-focused one. The pricing strategy is not explicitly compared to rivals, but the average price suggests a mid-tier position, likely appealing to consumers seeking quality without the premium tag.
Shelf presence
Brand Power (0-100) blends four shelf signals. Price position is shown below for context · a value↔premium read, not part of the score.
Store brand. Whole Foods Market is exclusive to Whole Foods Market by design, so Distribution · and therefore Brand Power · reads low next to national brands. Judge it against other store brands, not the shelf leaders.
exclusive to Whole Foods Market. store brands sell in one chain by design, which caps this.
212 products in the catalog. how deep the product line is (saturating).
Where it owns shelf
each bar is the % of that category's SKUs that are Whole Foods Market (full bar = 100% of the shelf), grouped by department.
Top competitors
the brands crowding the same categories as Whole Foods Market · photographed shelf-mates first, then brands stocked beside it at the same grocers, then same-category rivals citywide.


The lineup
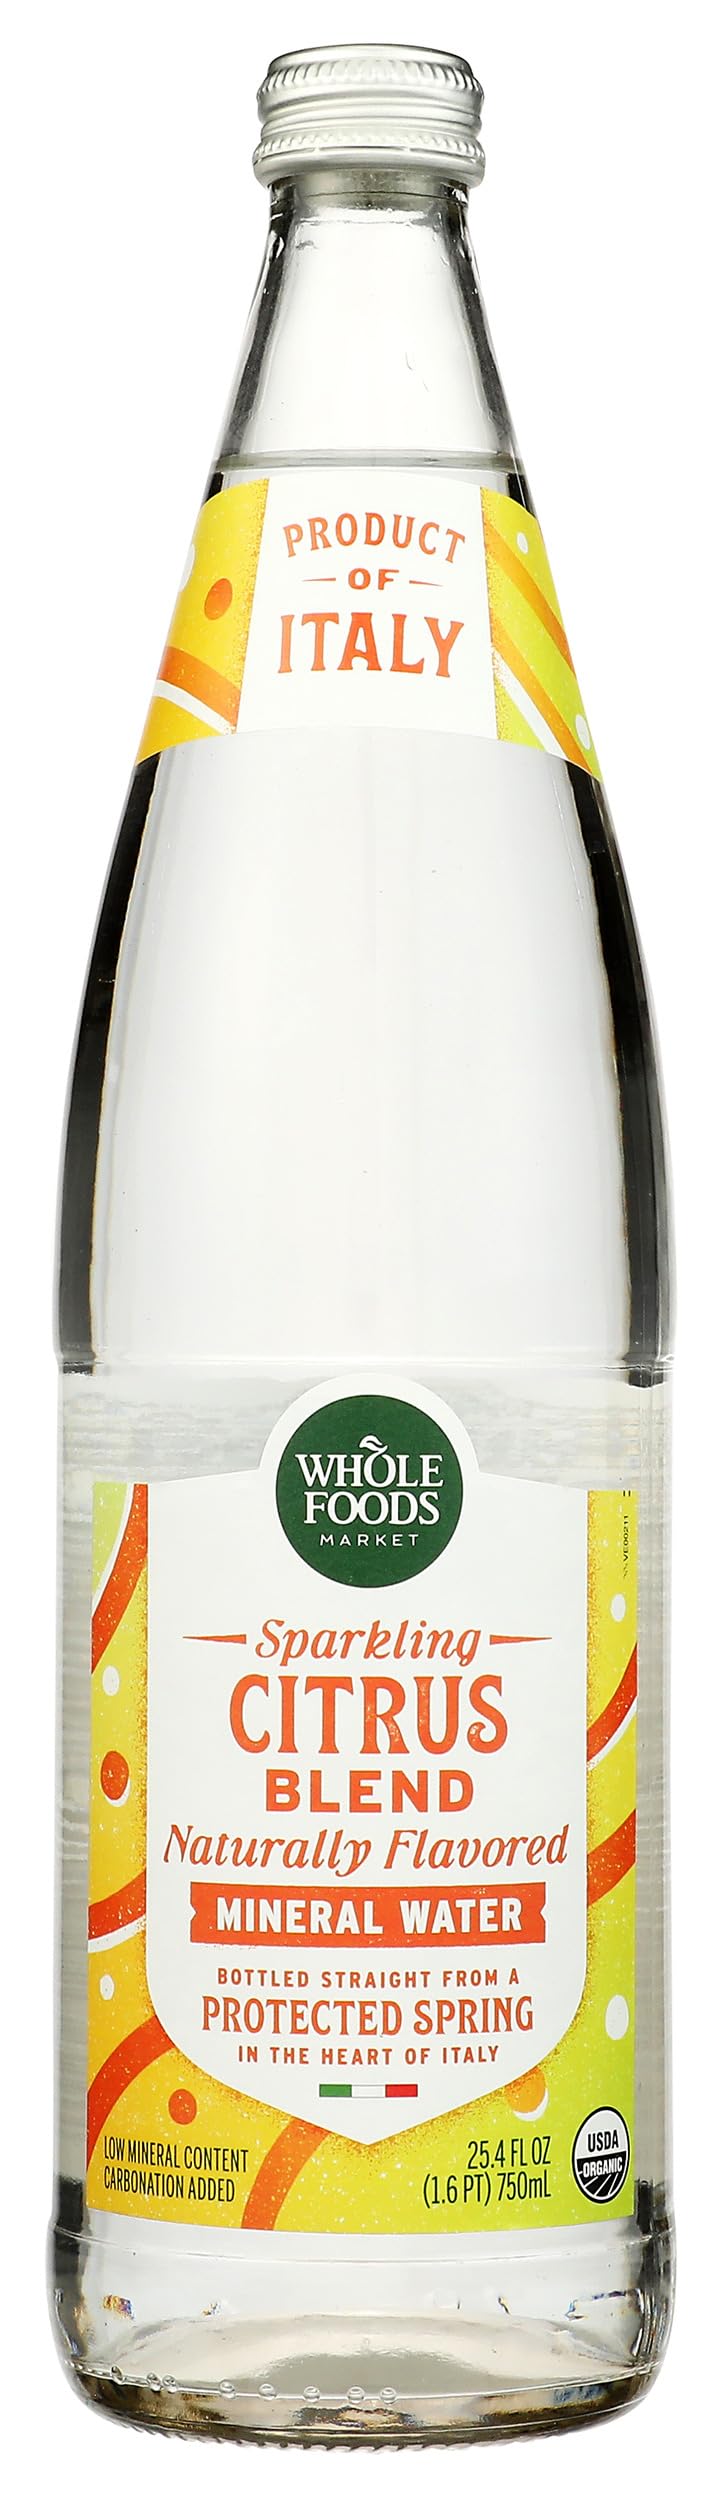
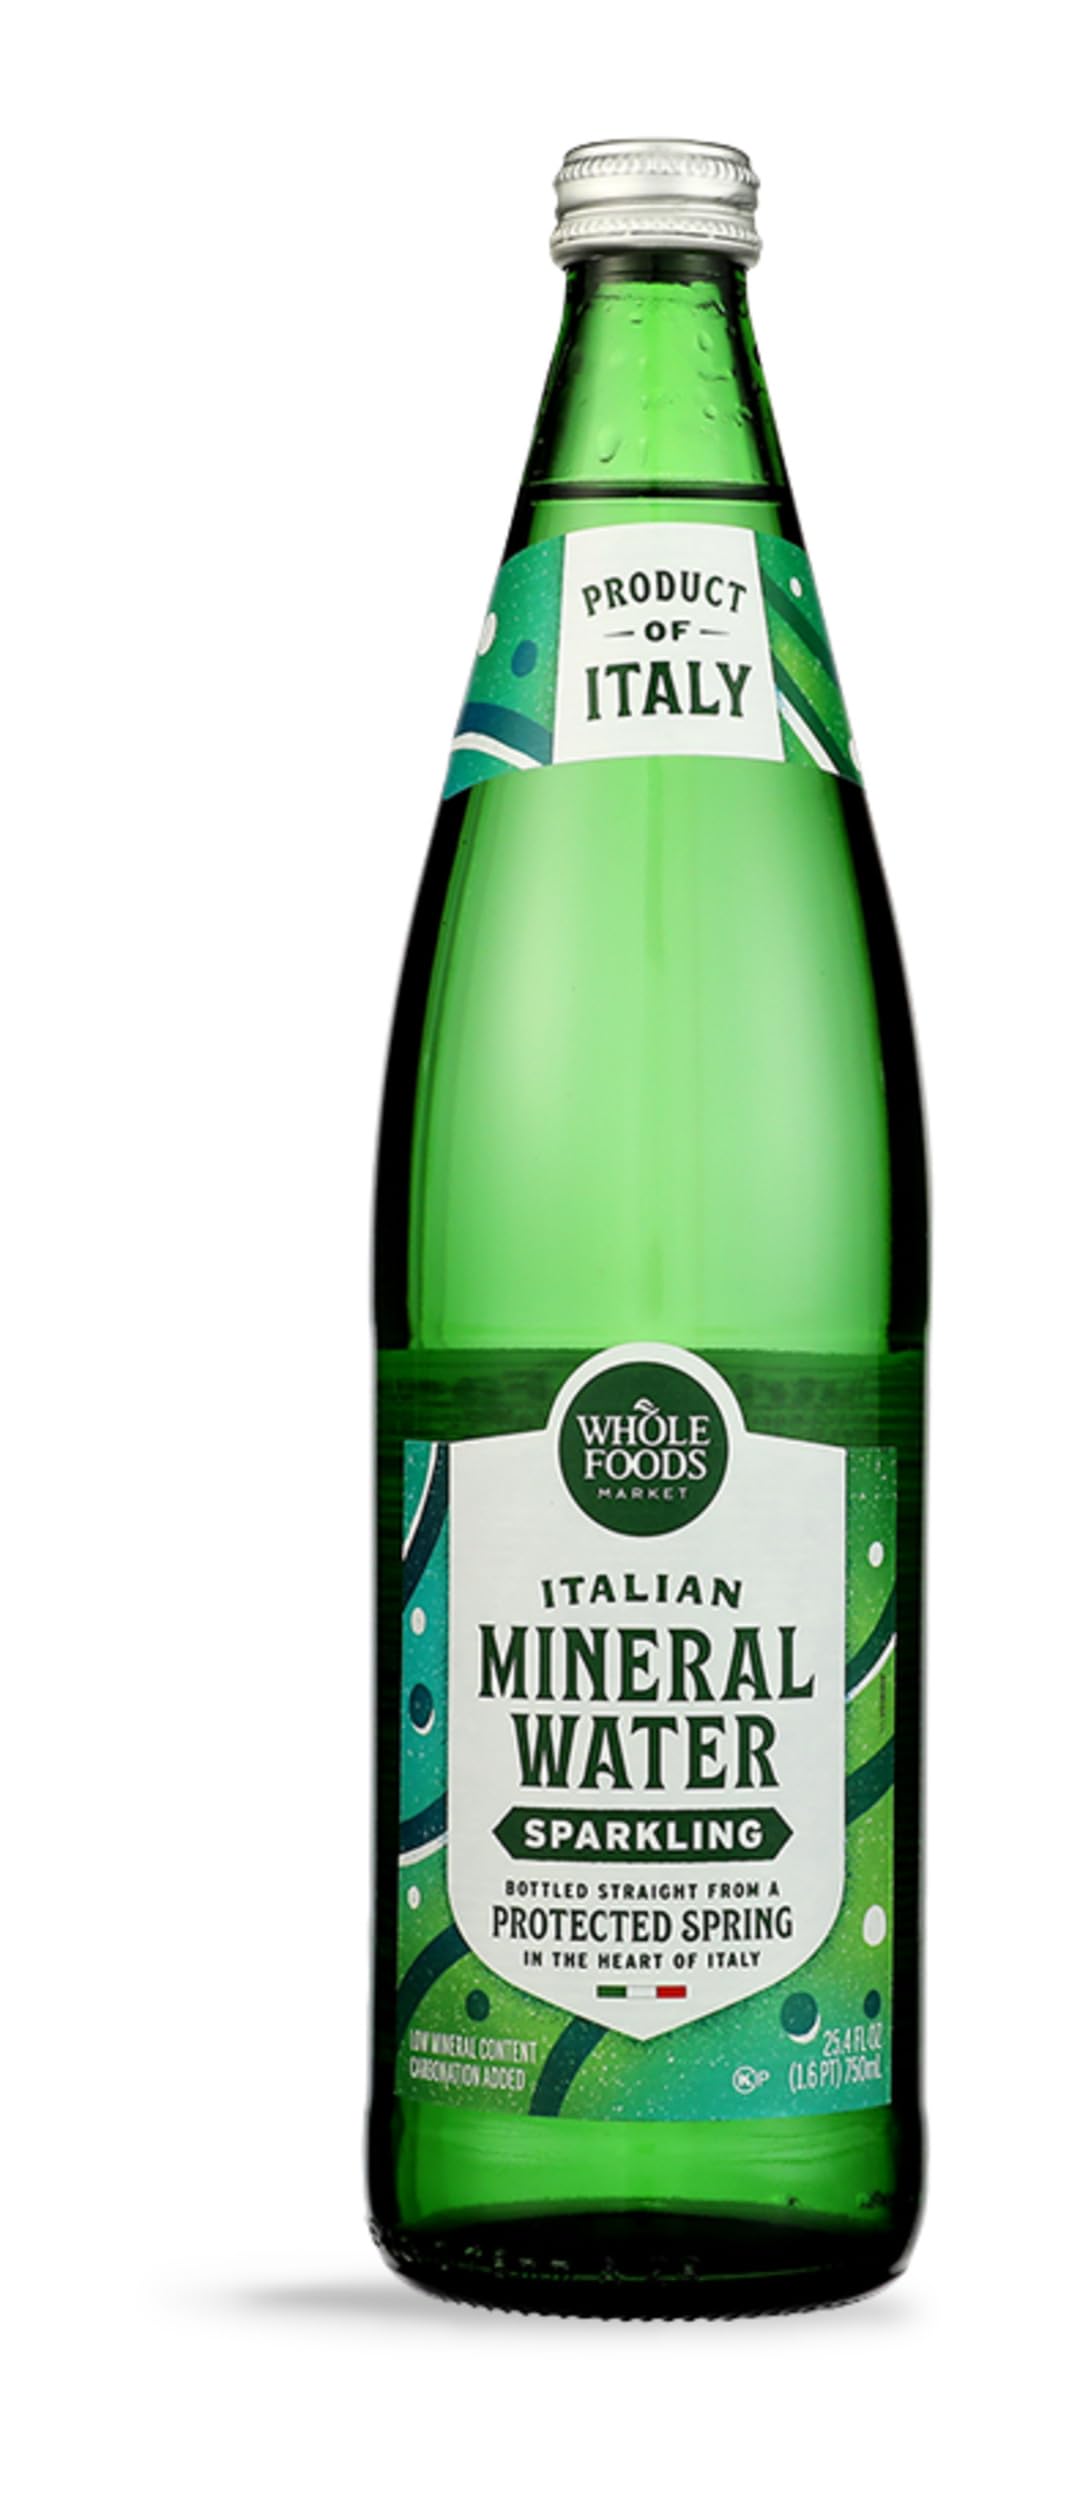
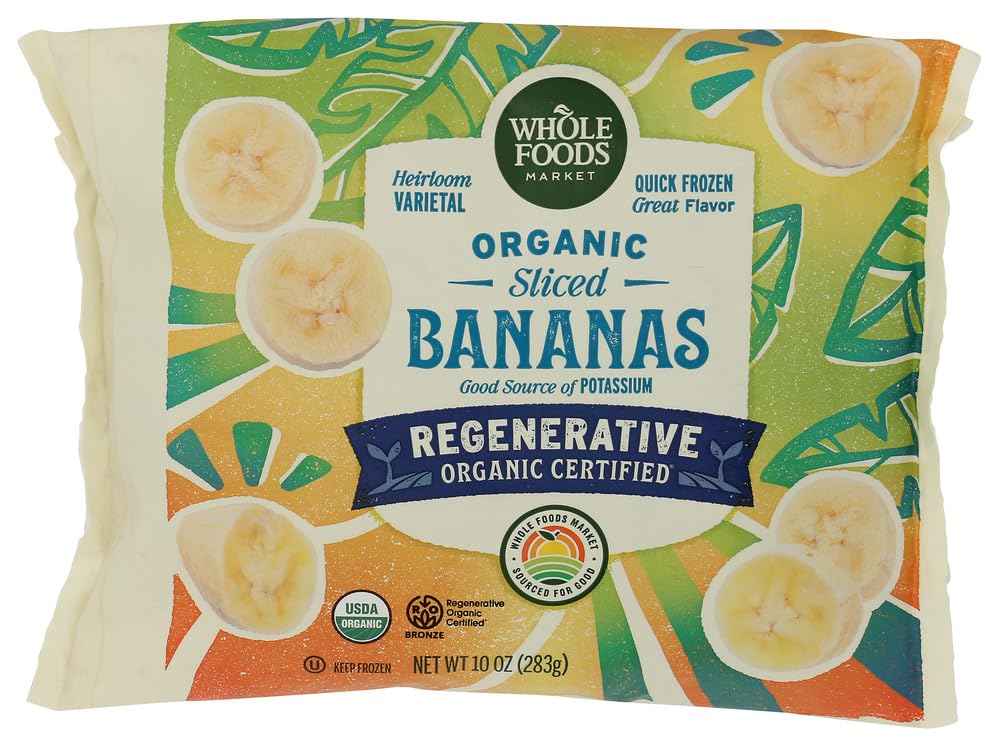
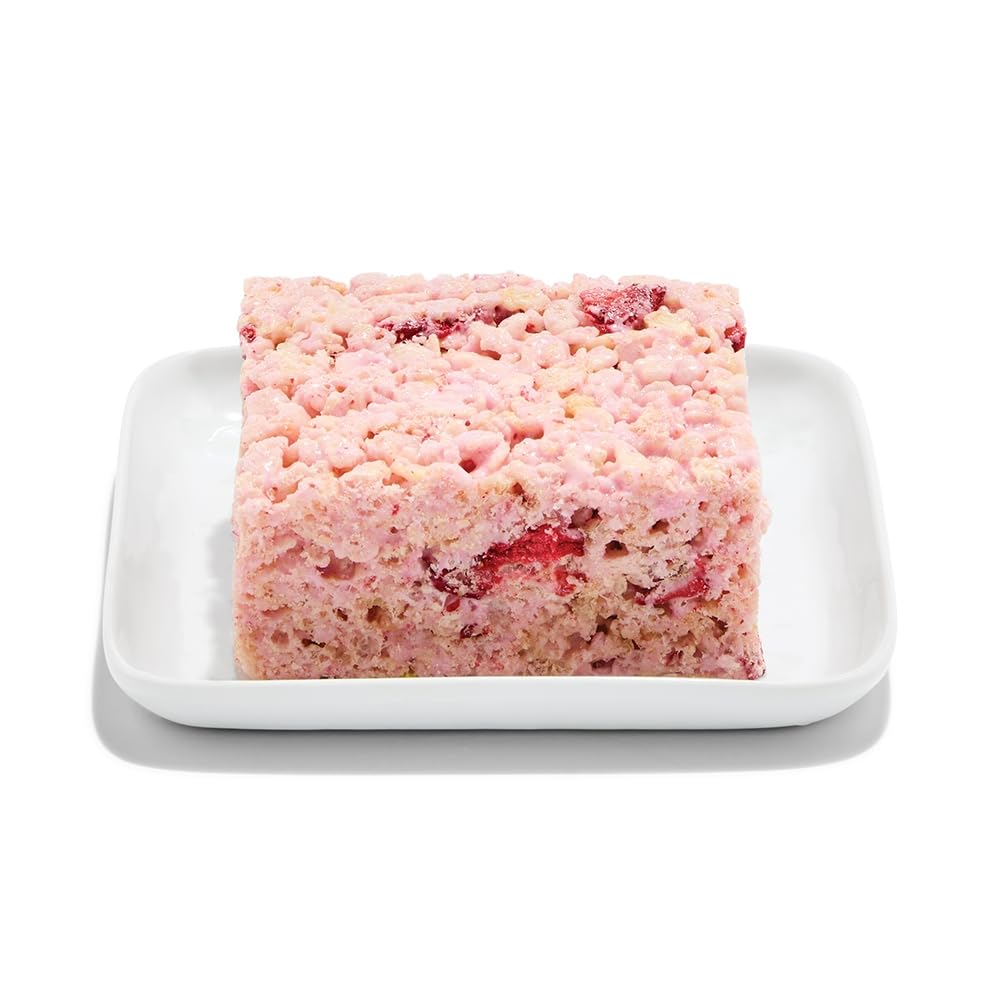
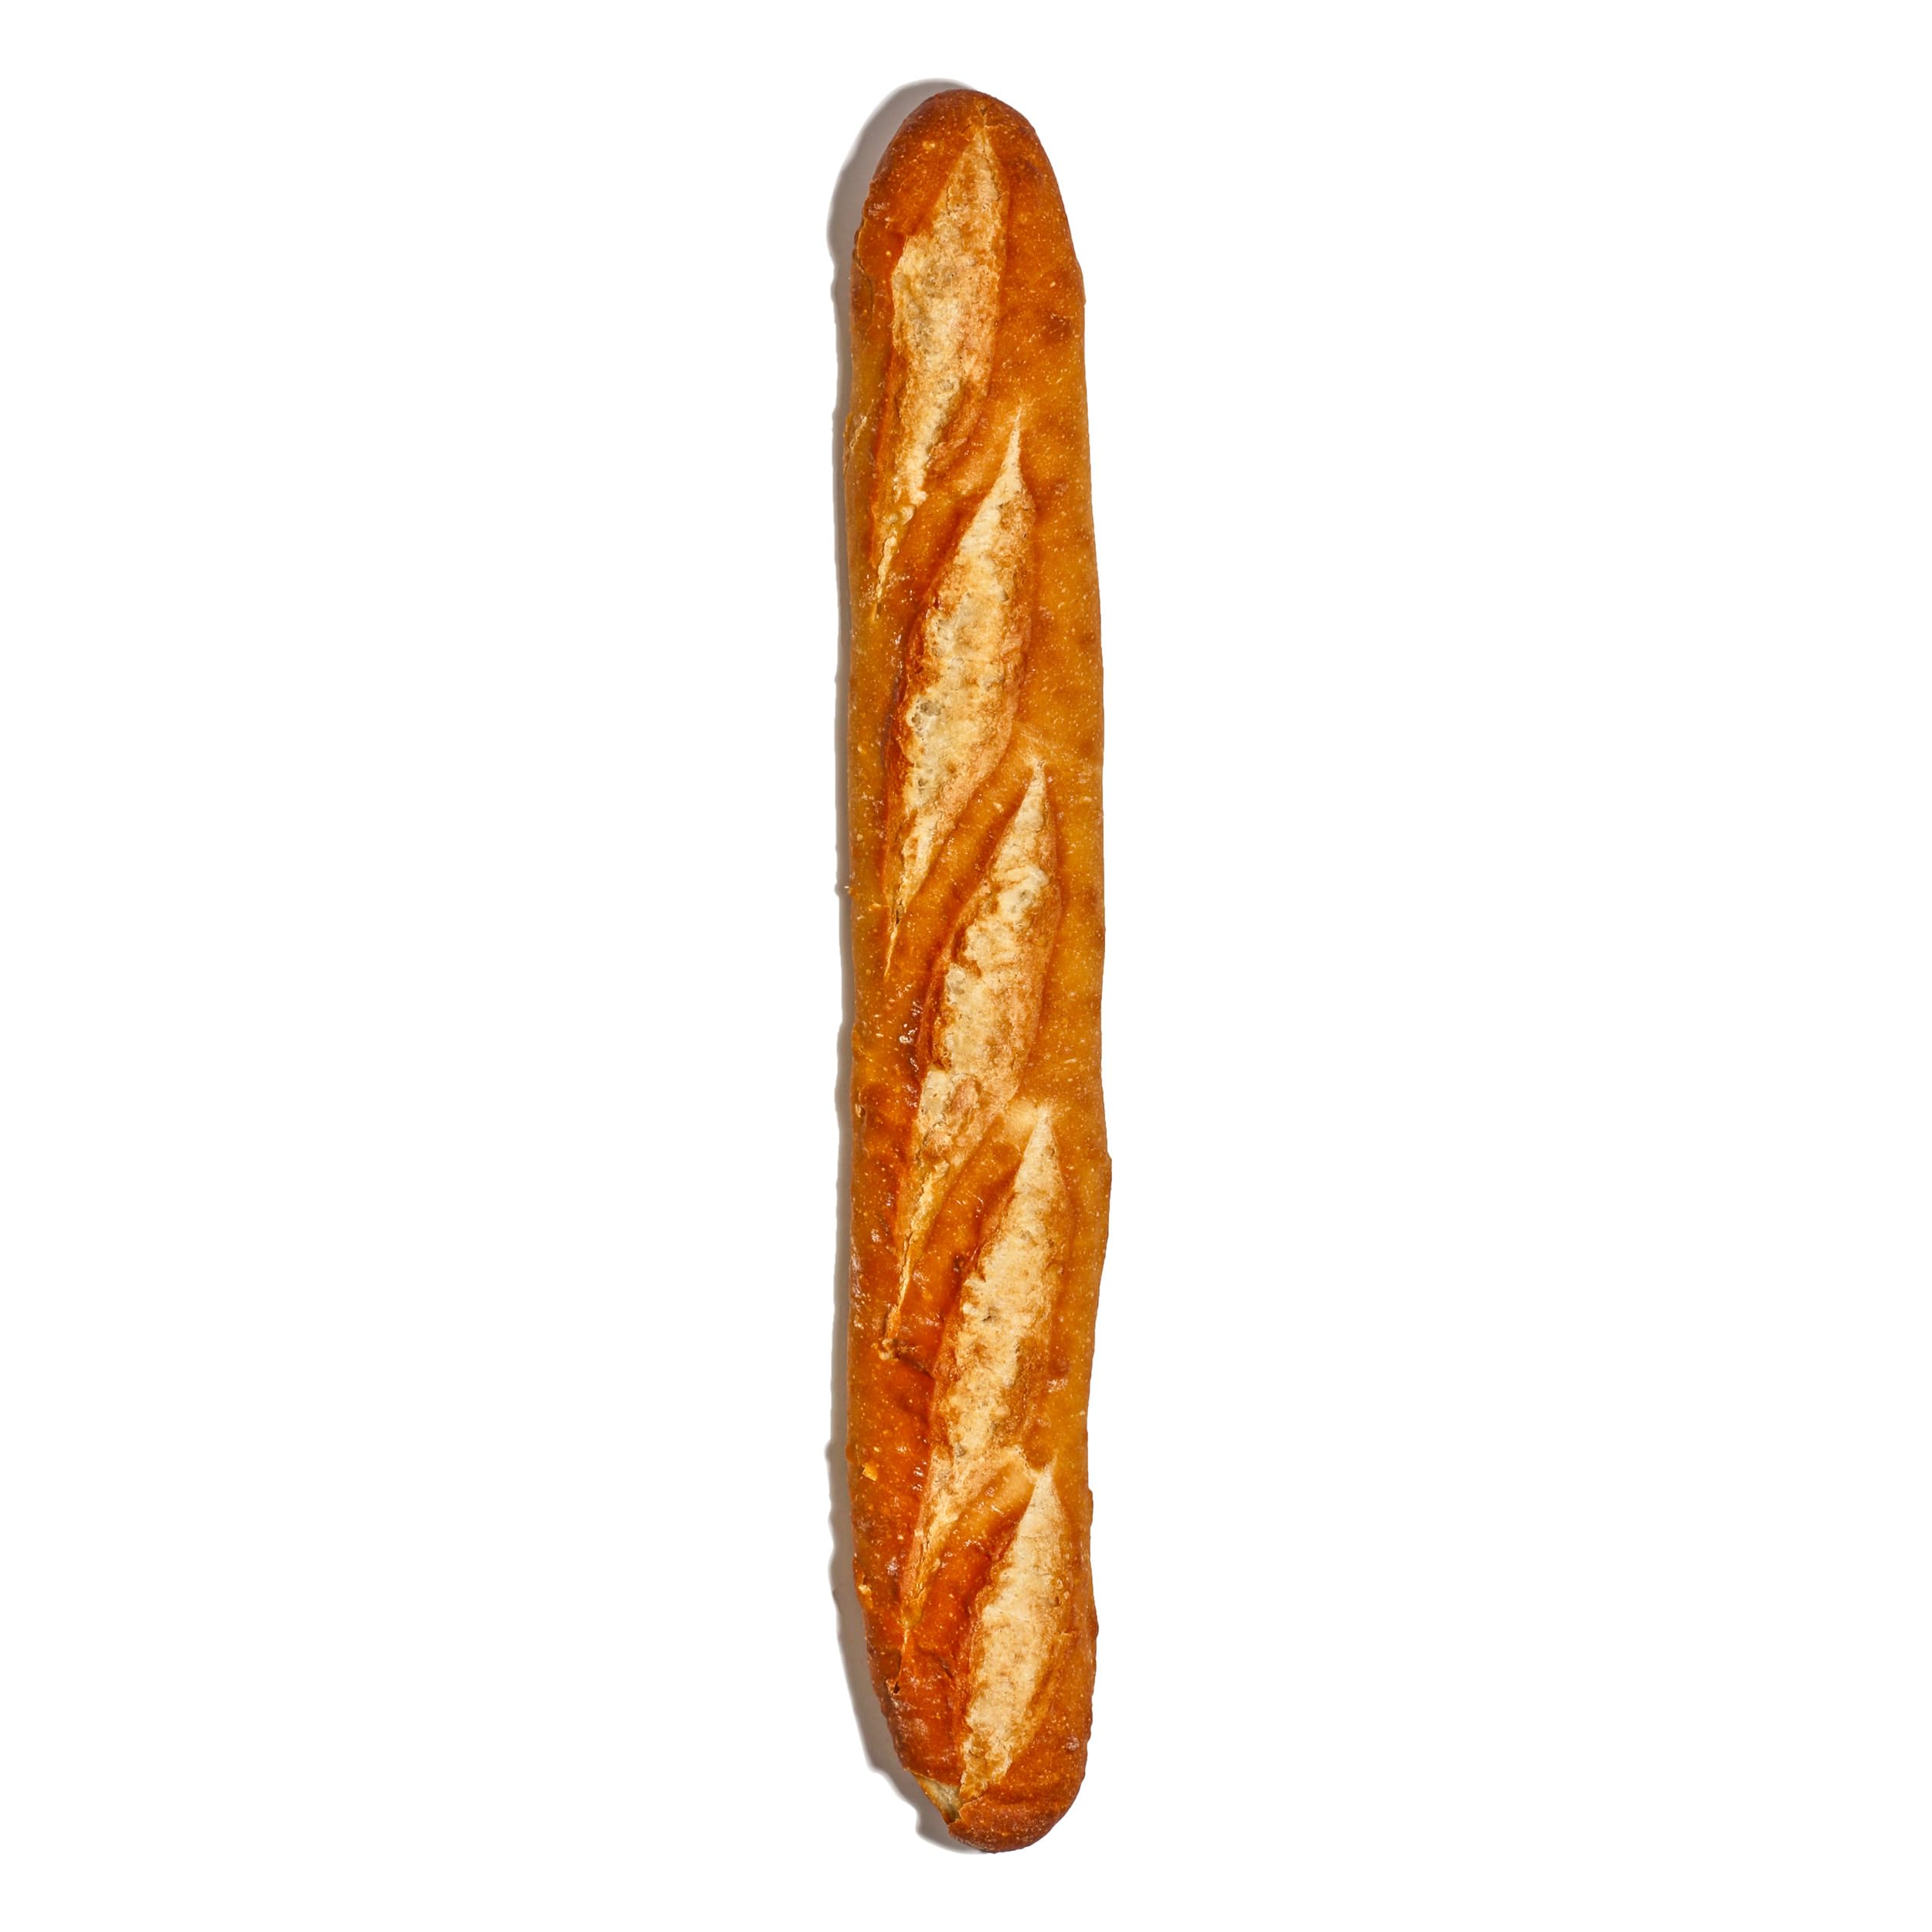
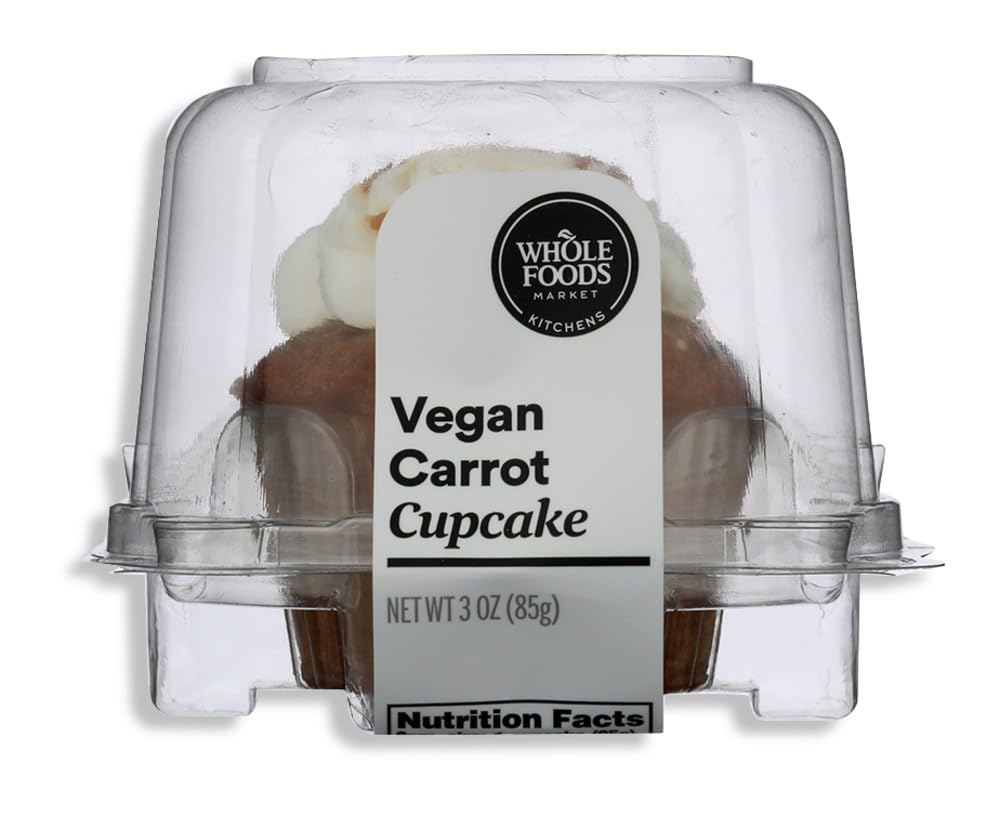
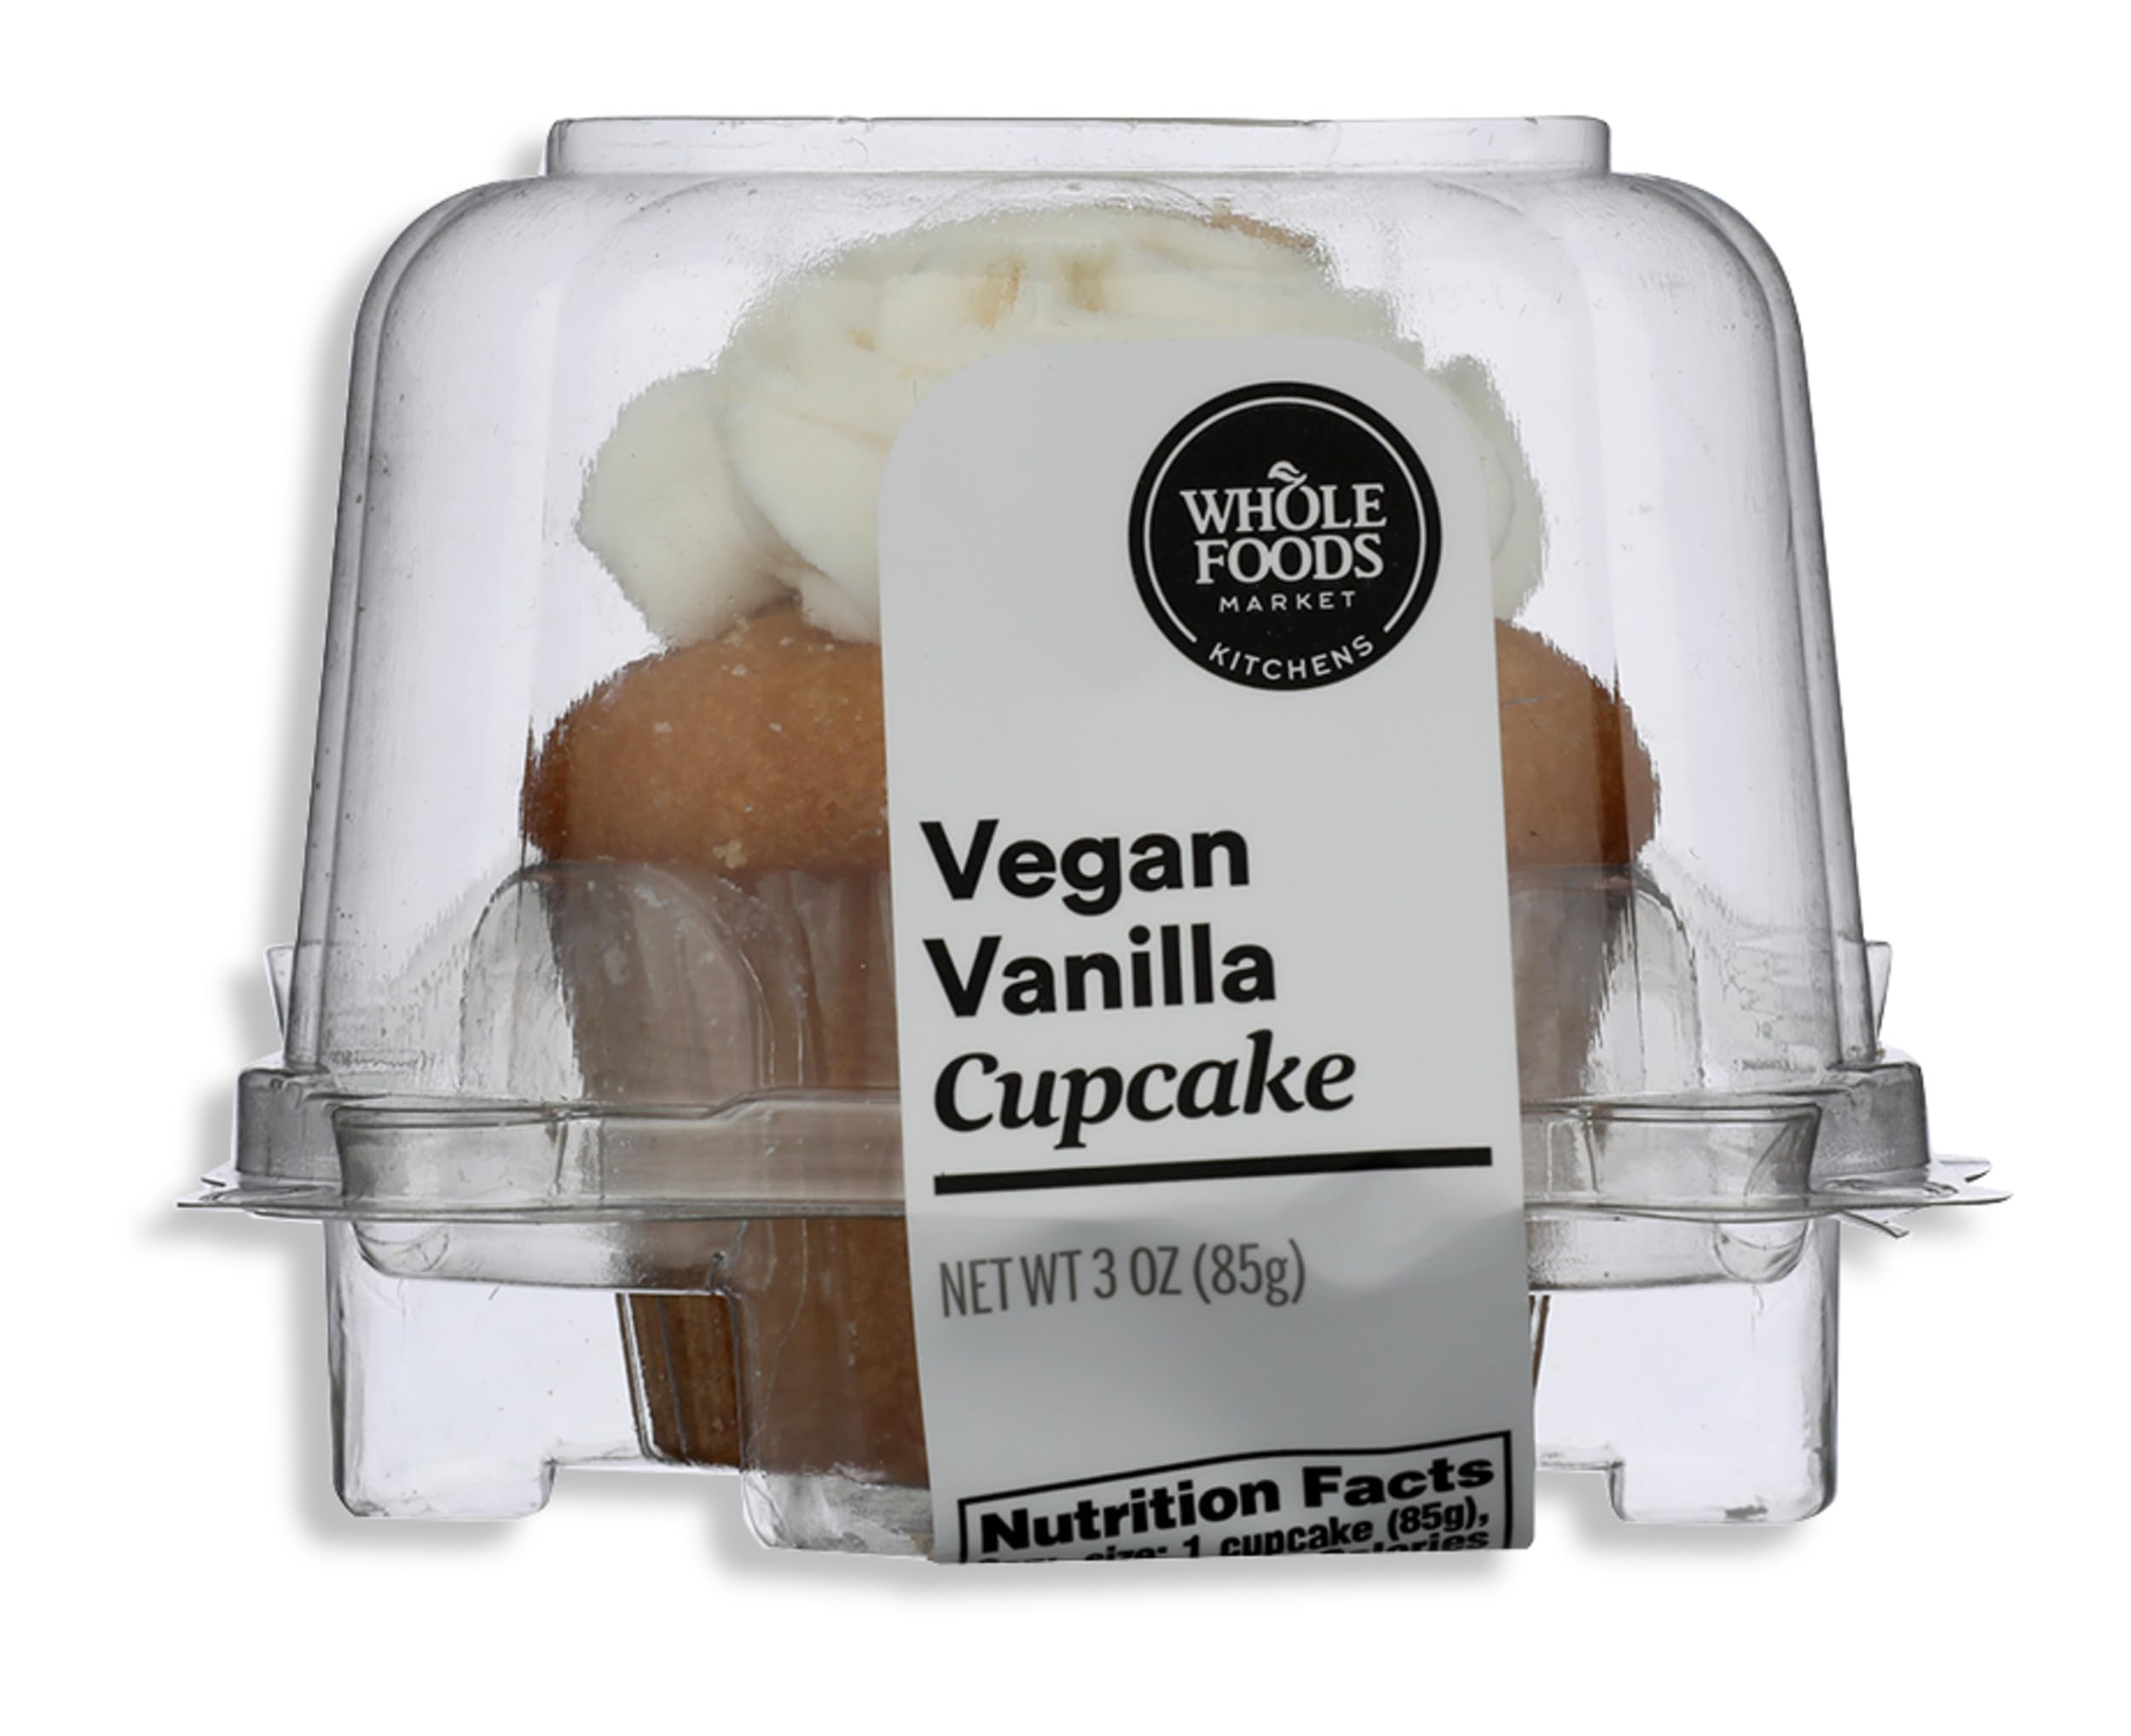
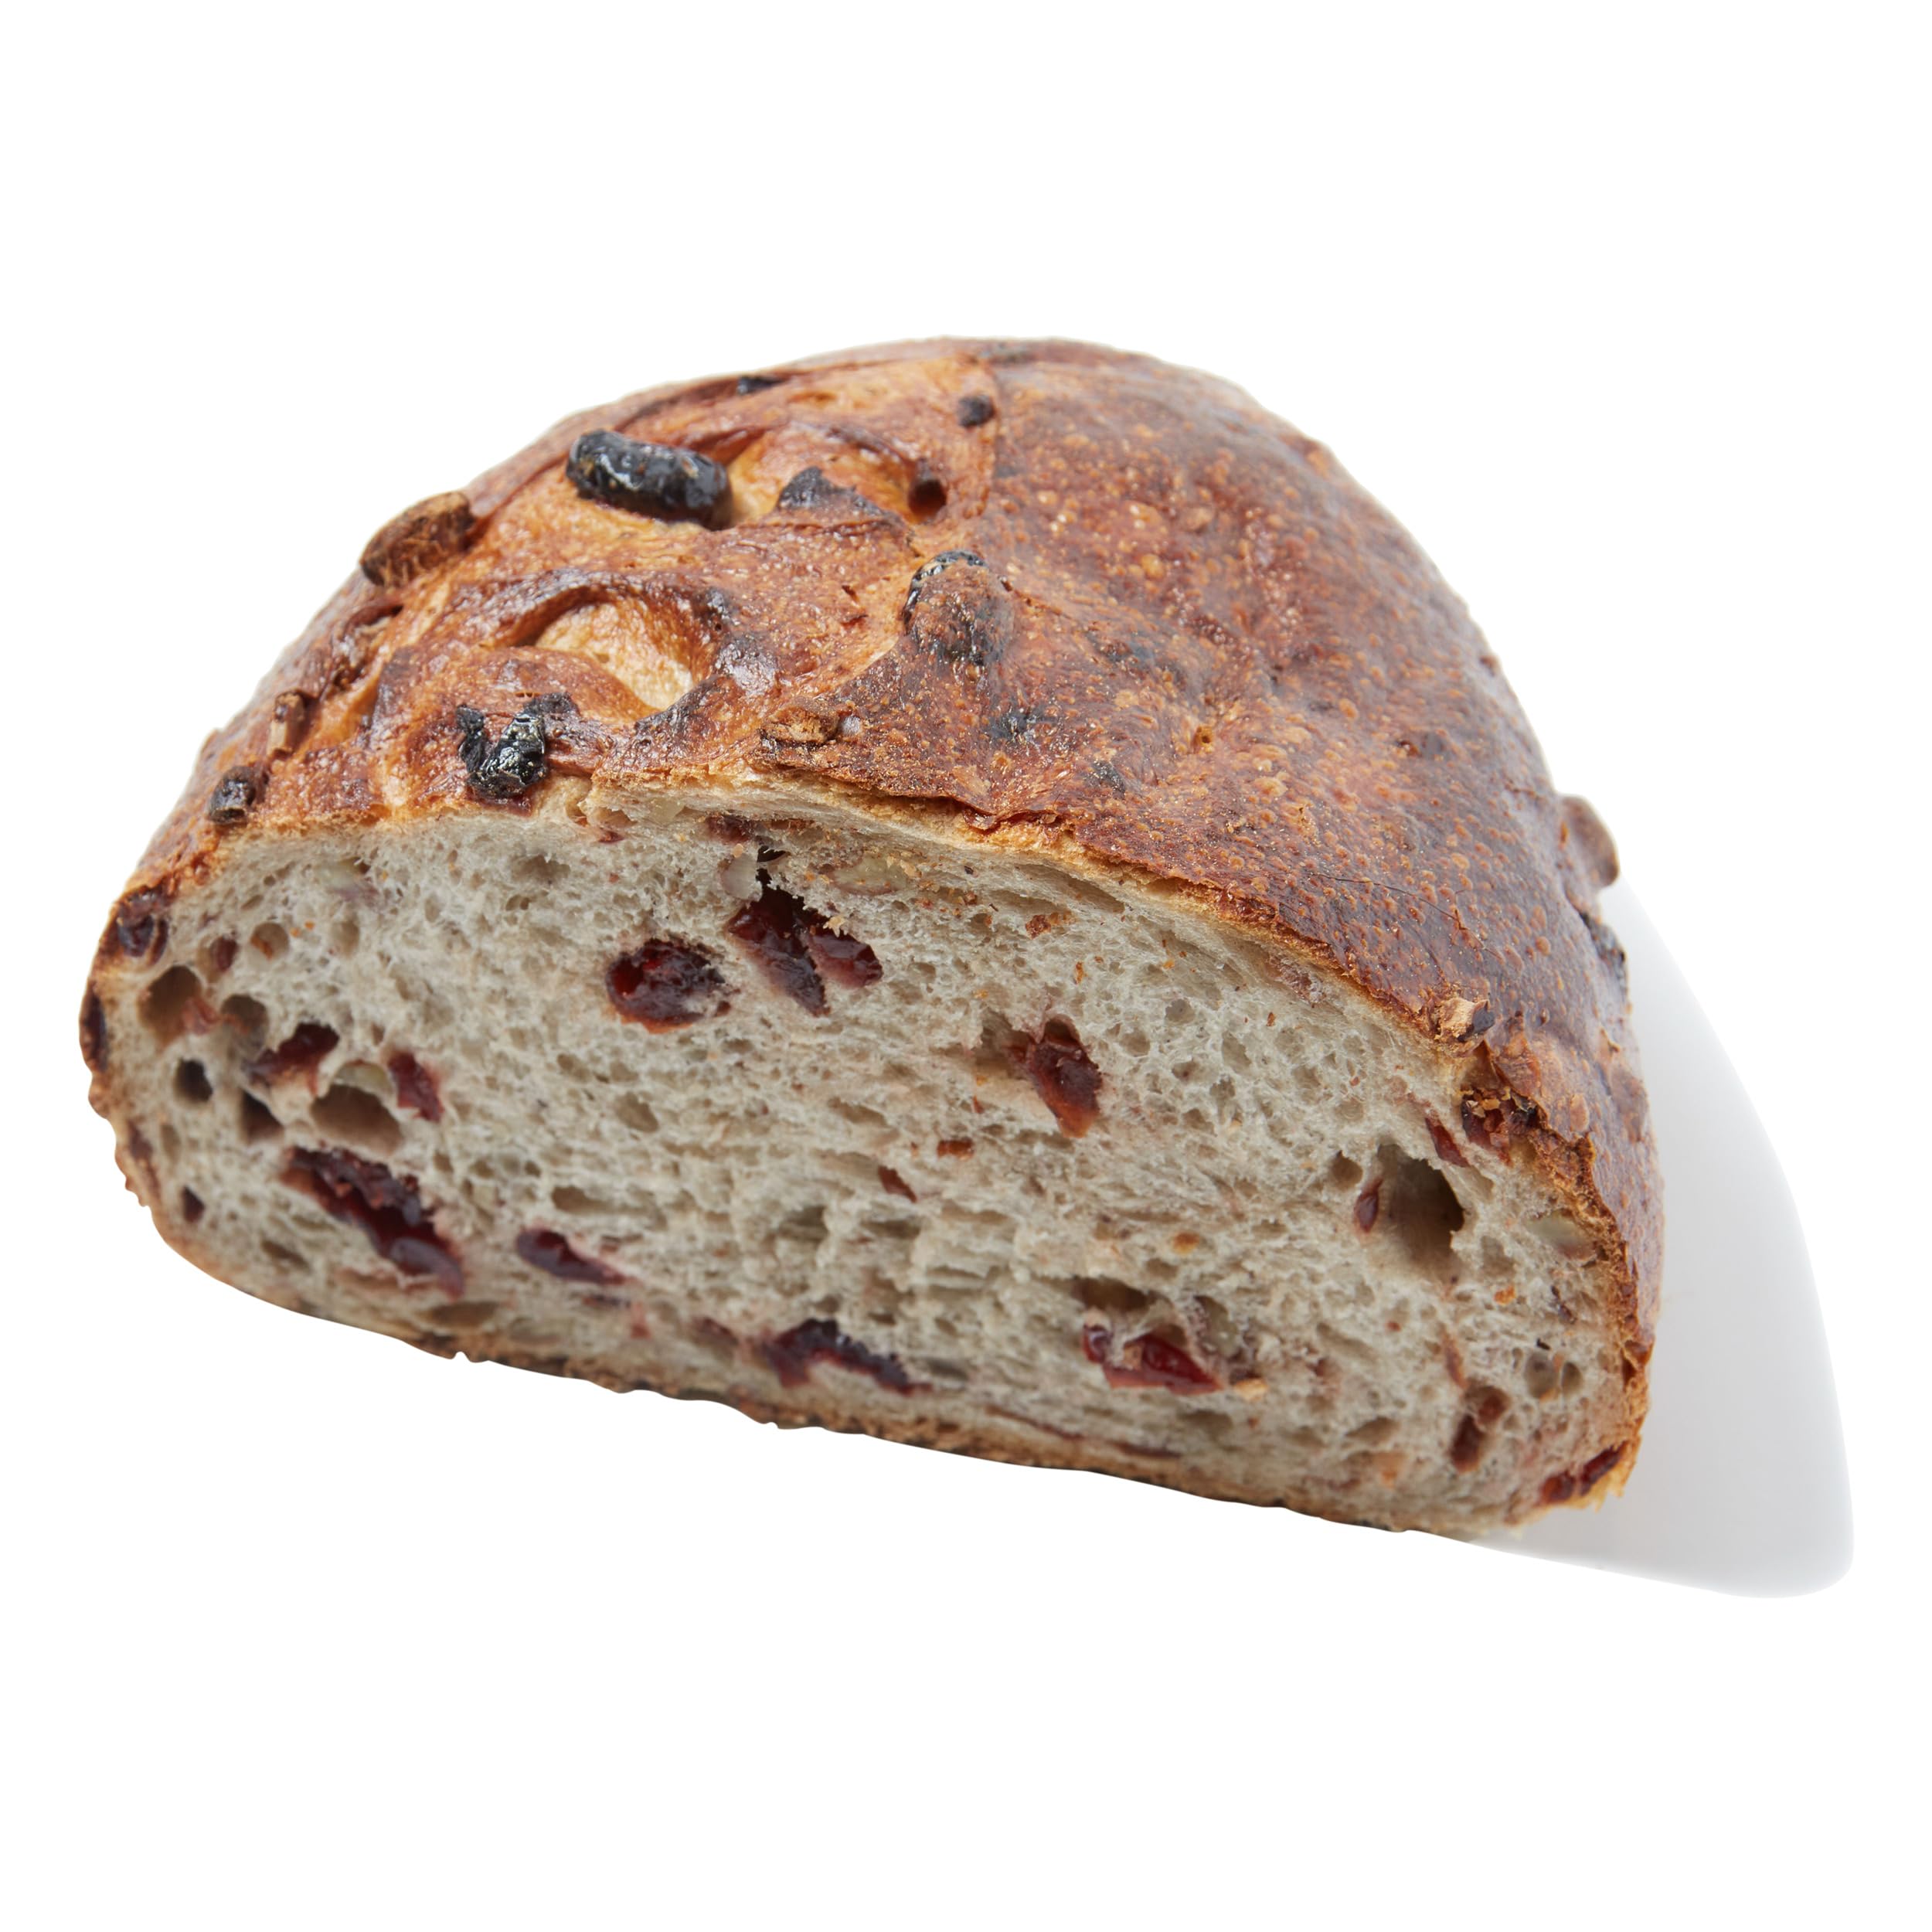
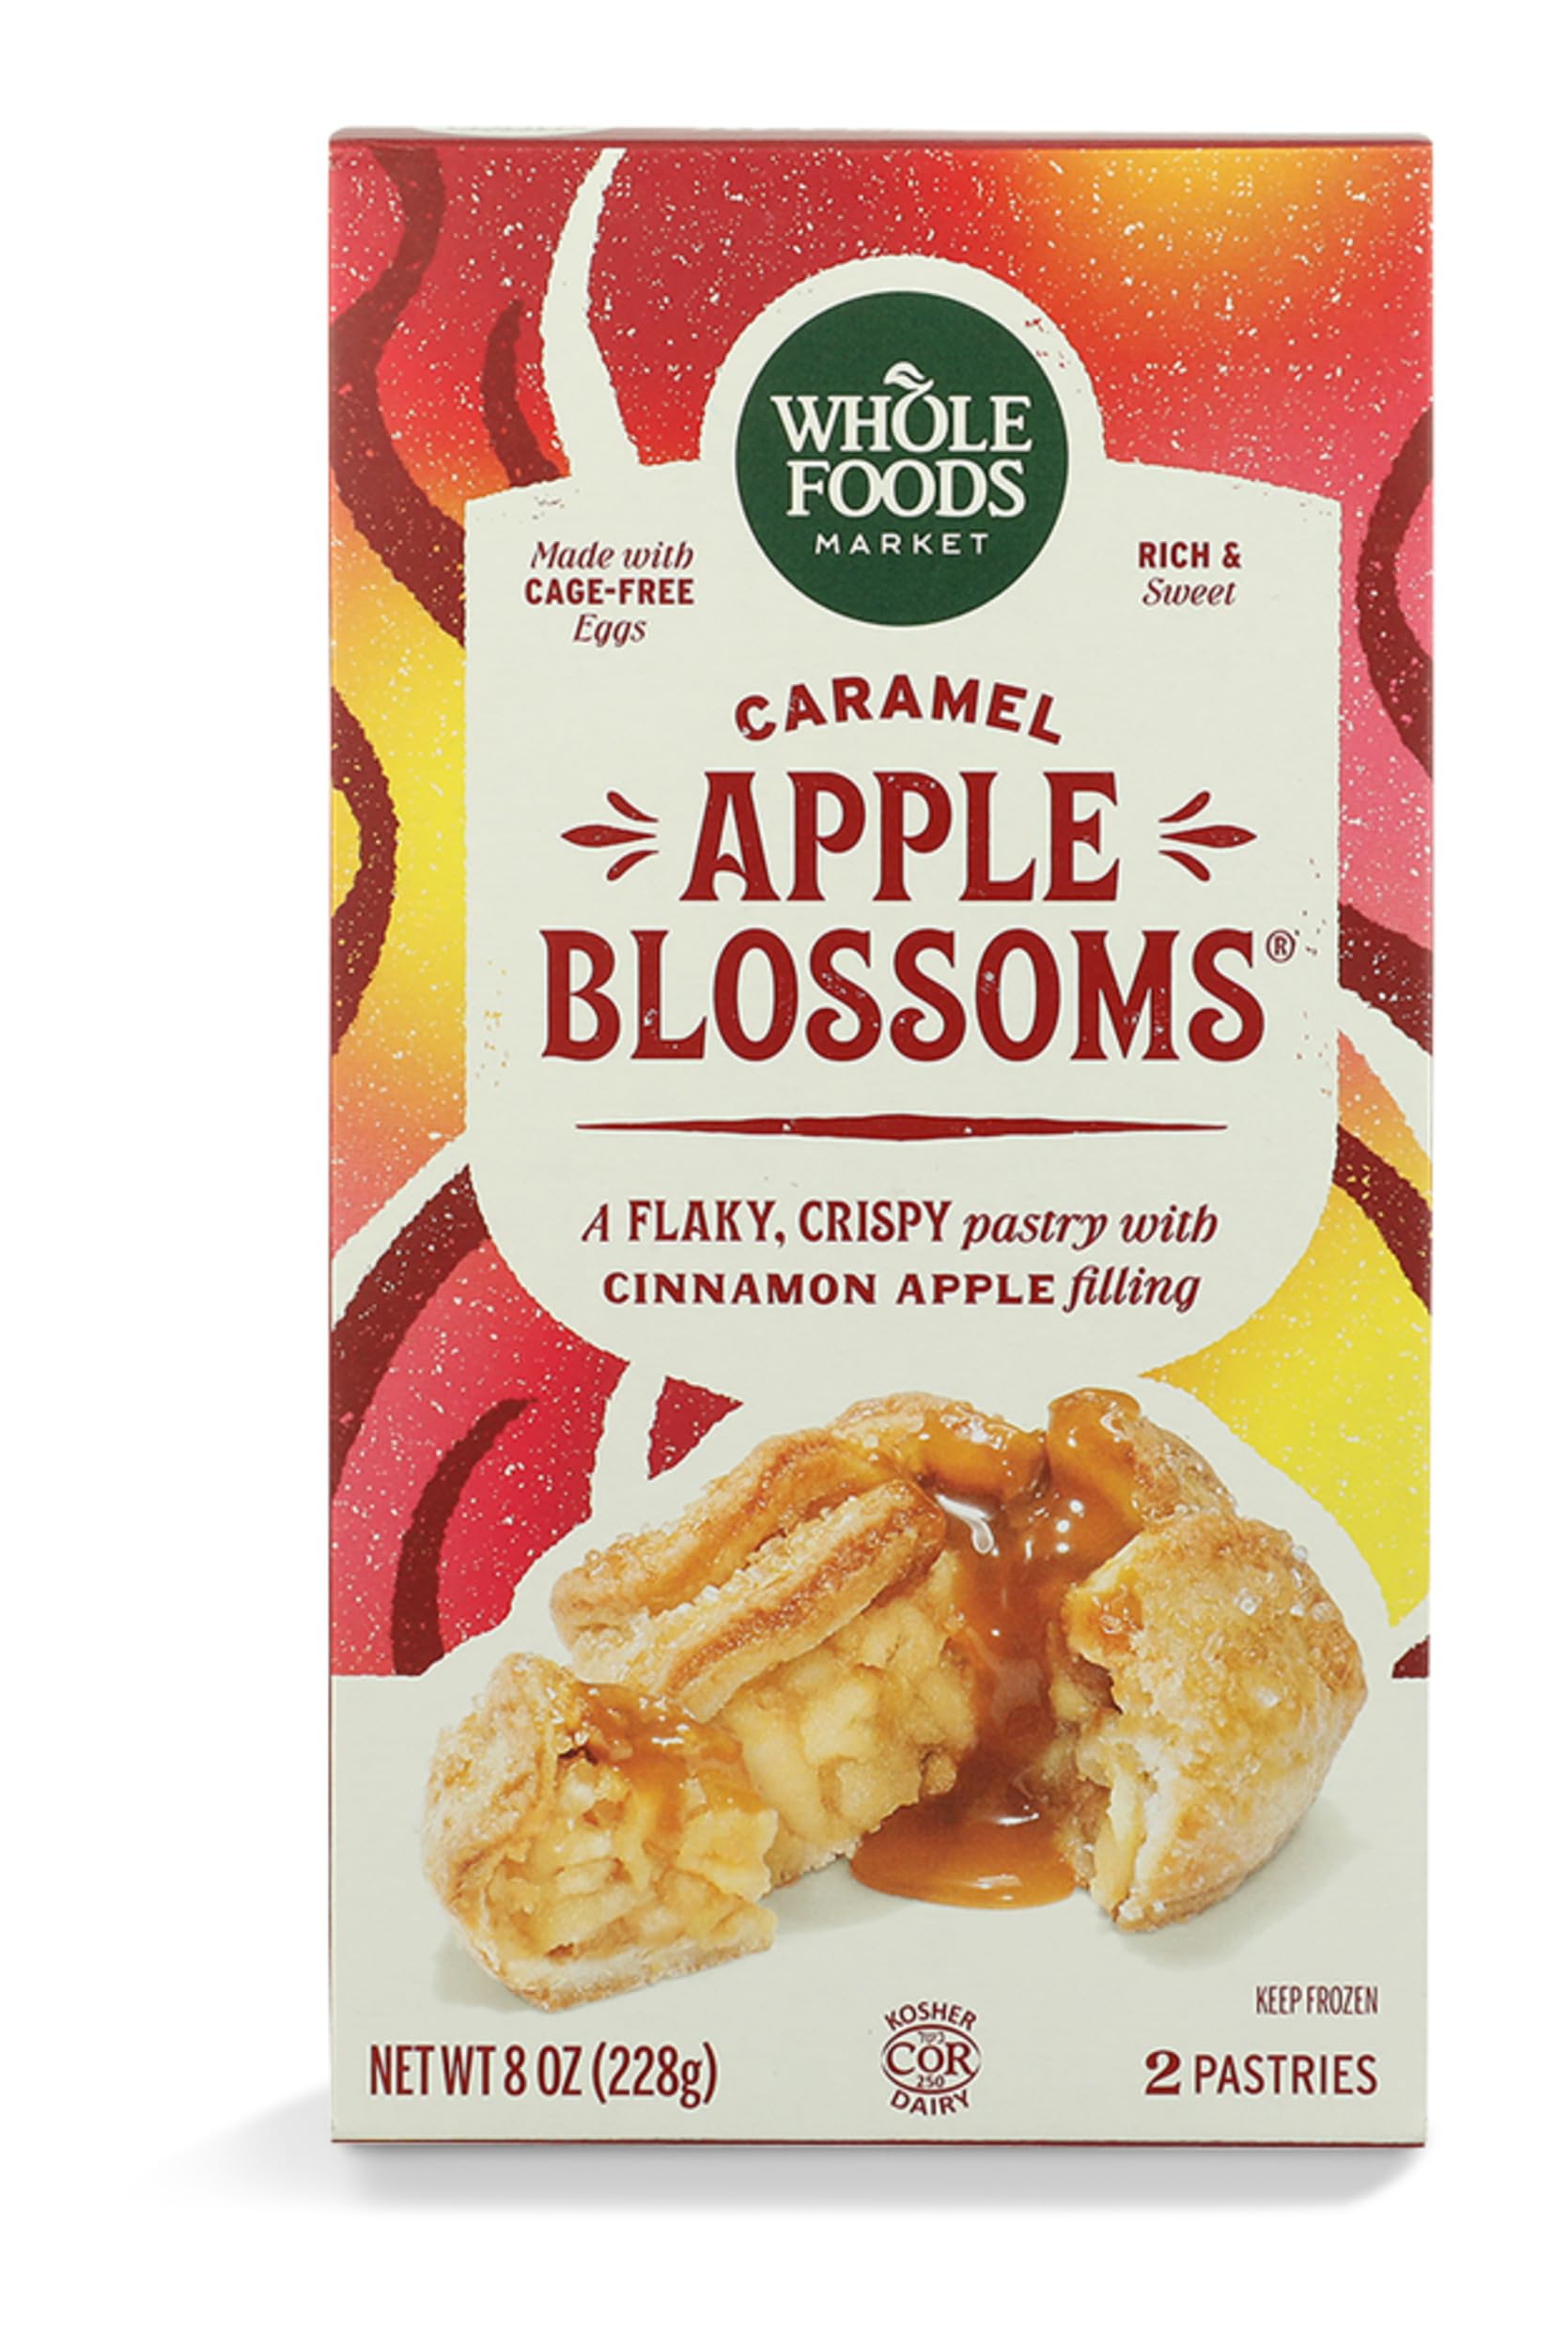
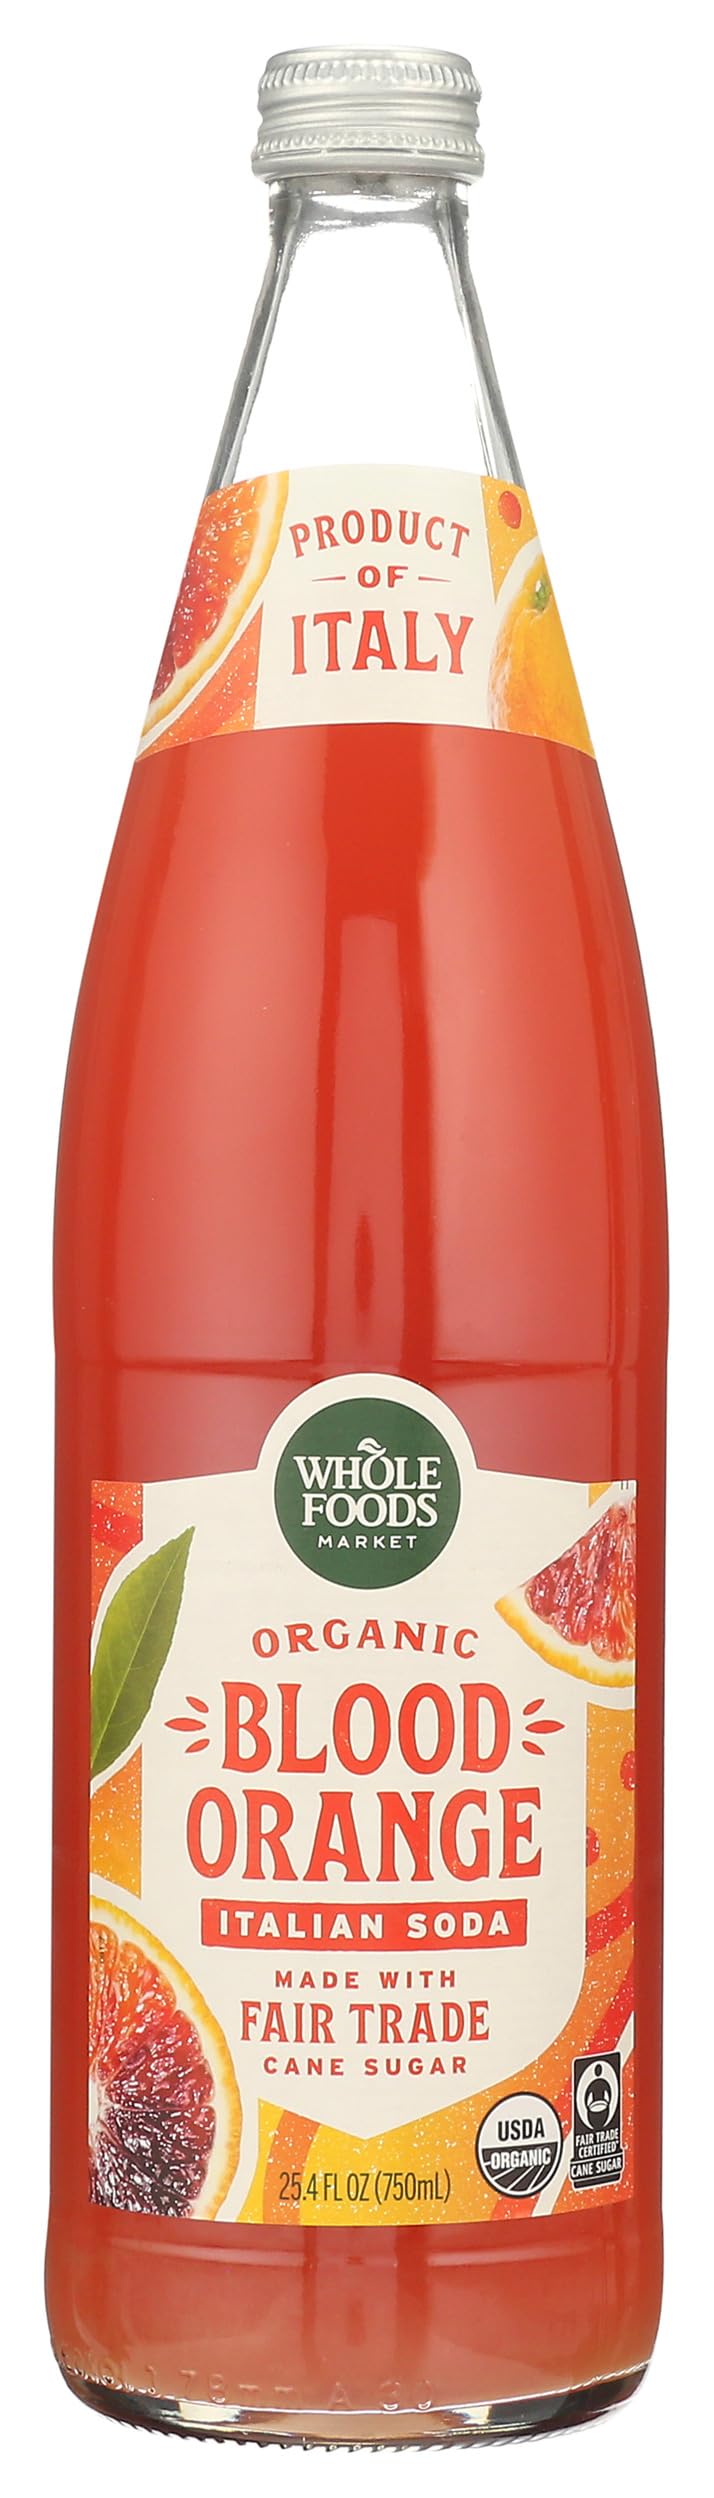
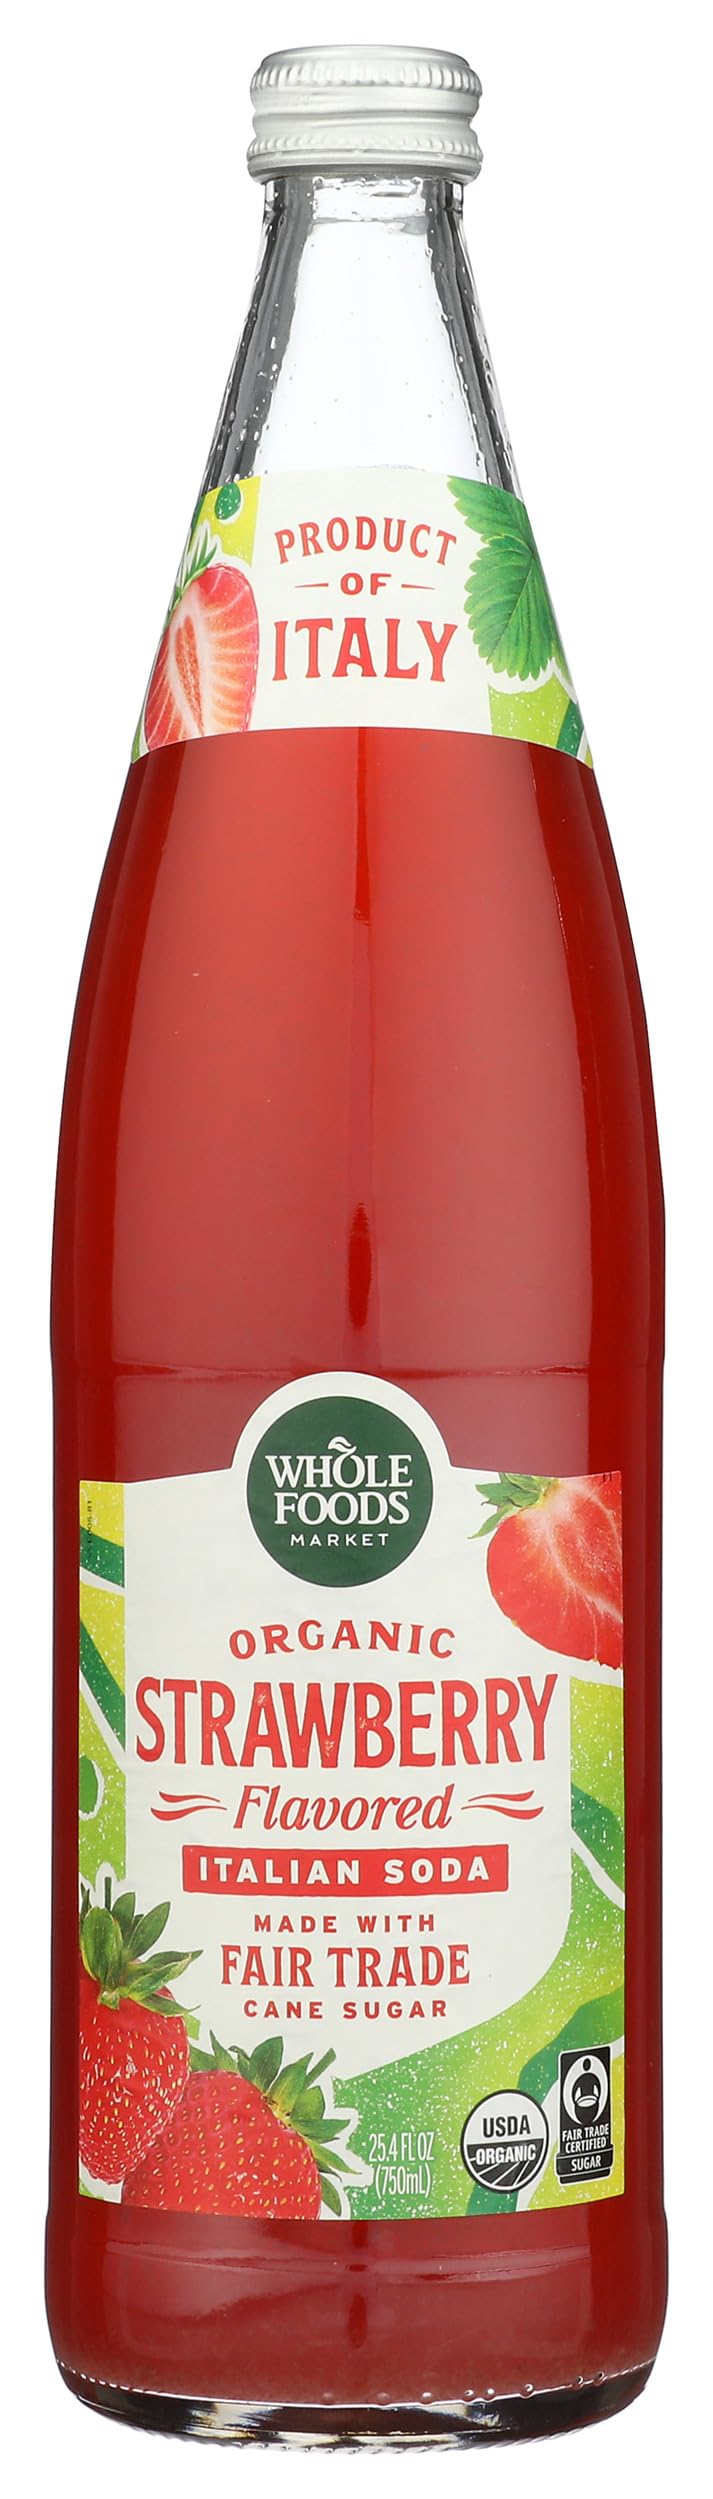
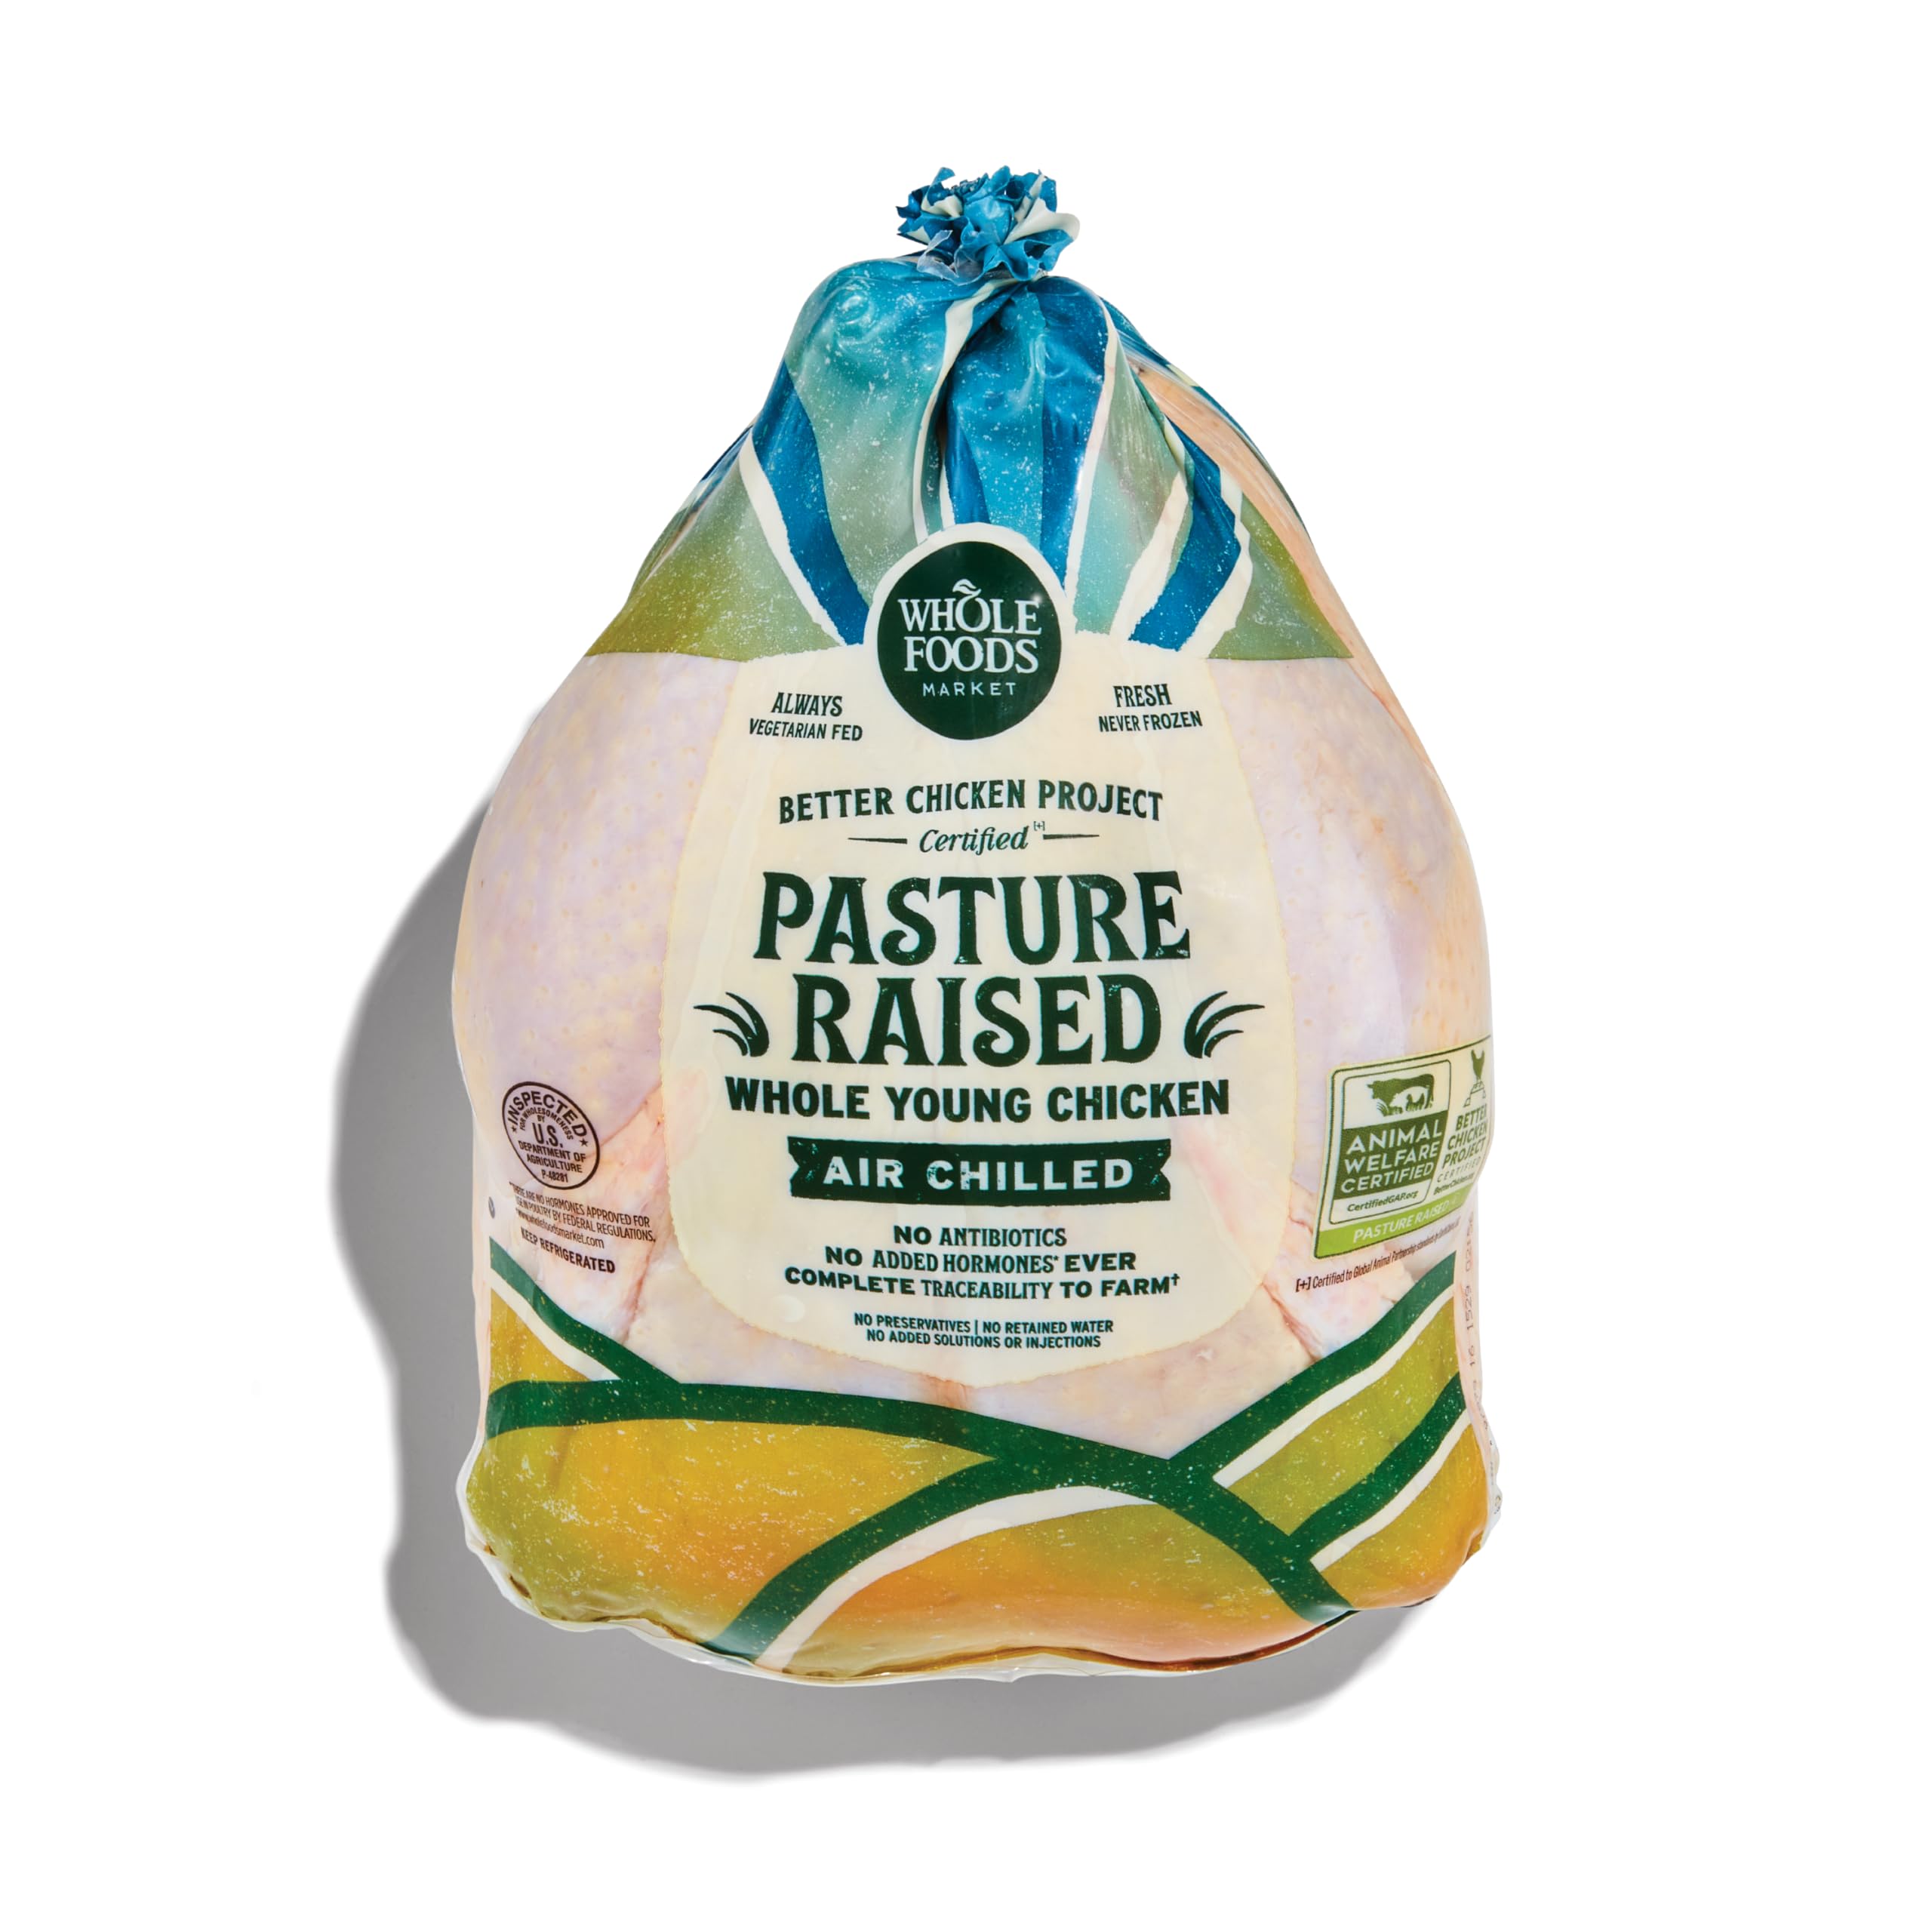
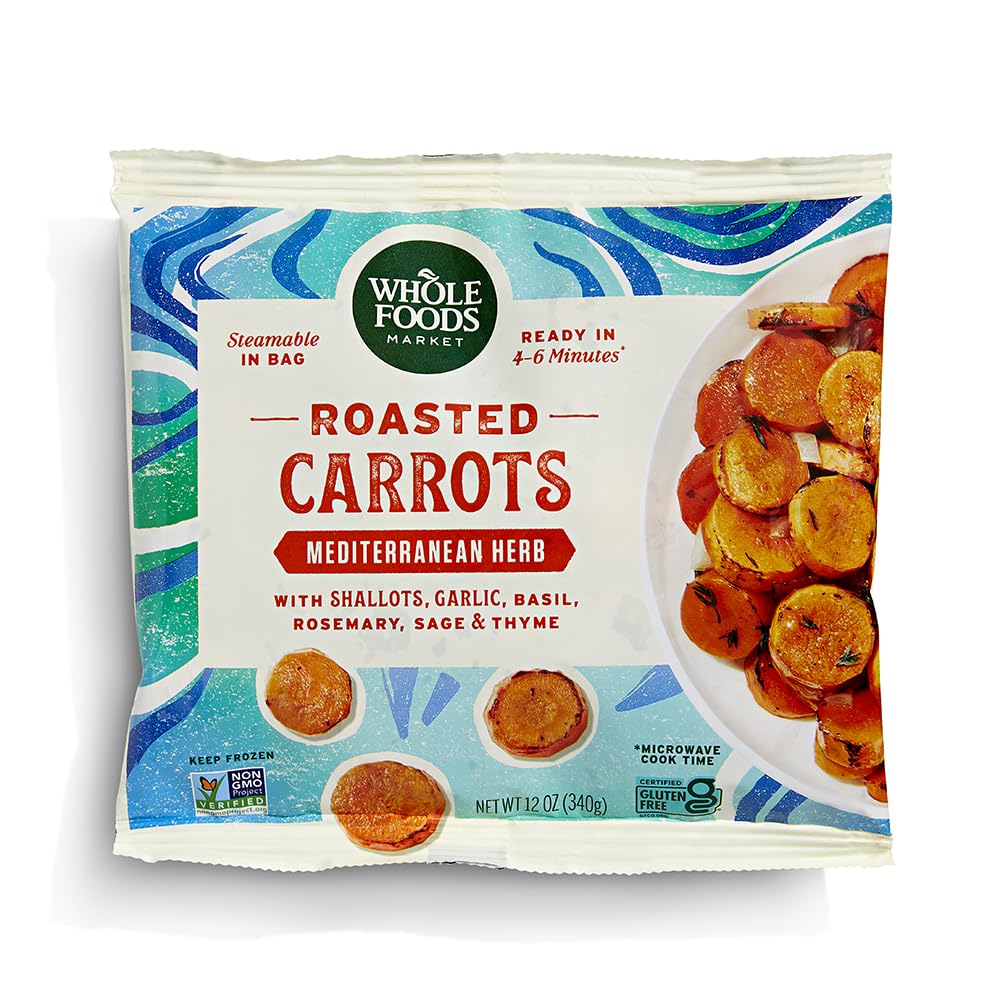
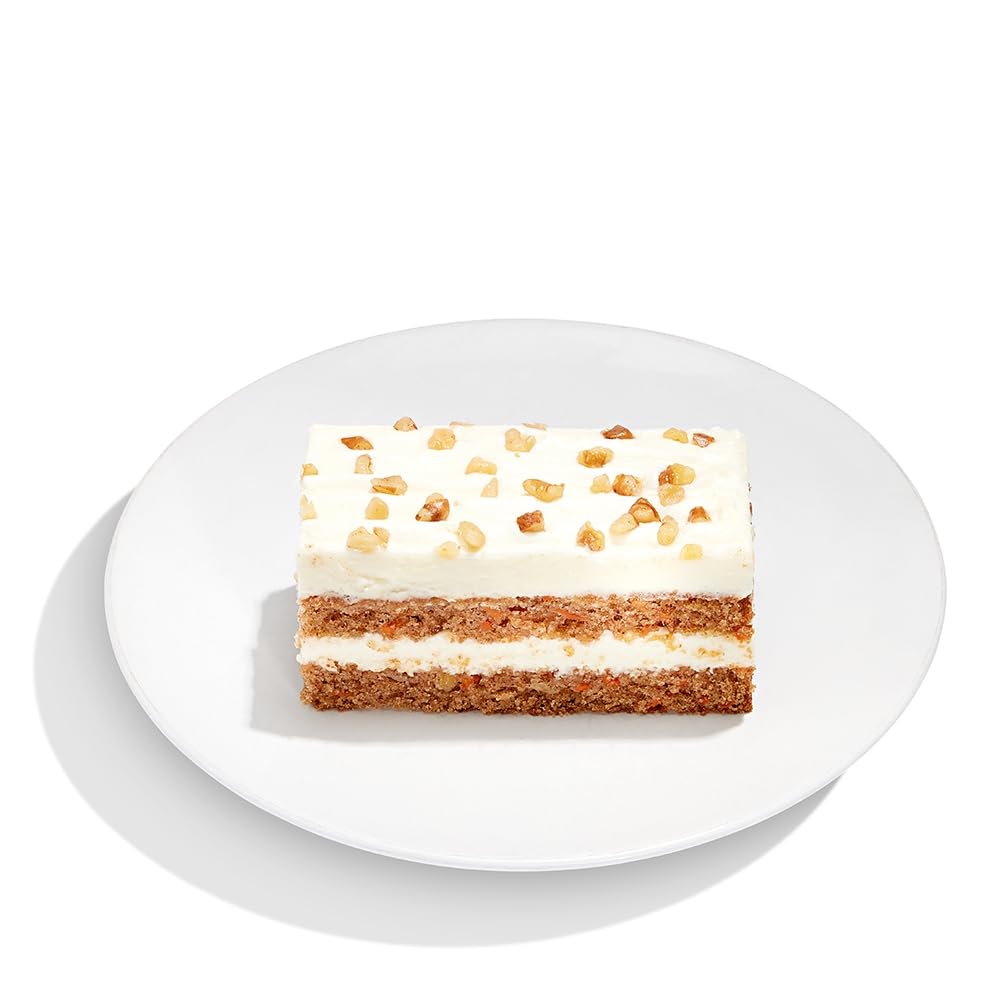
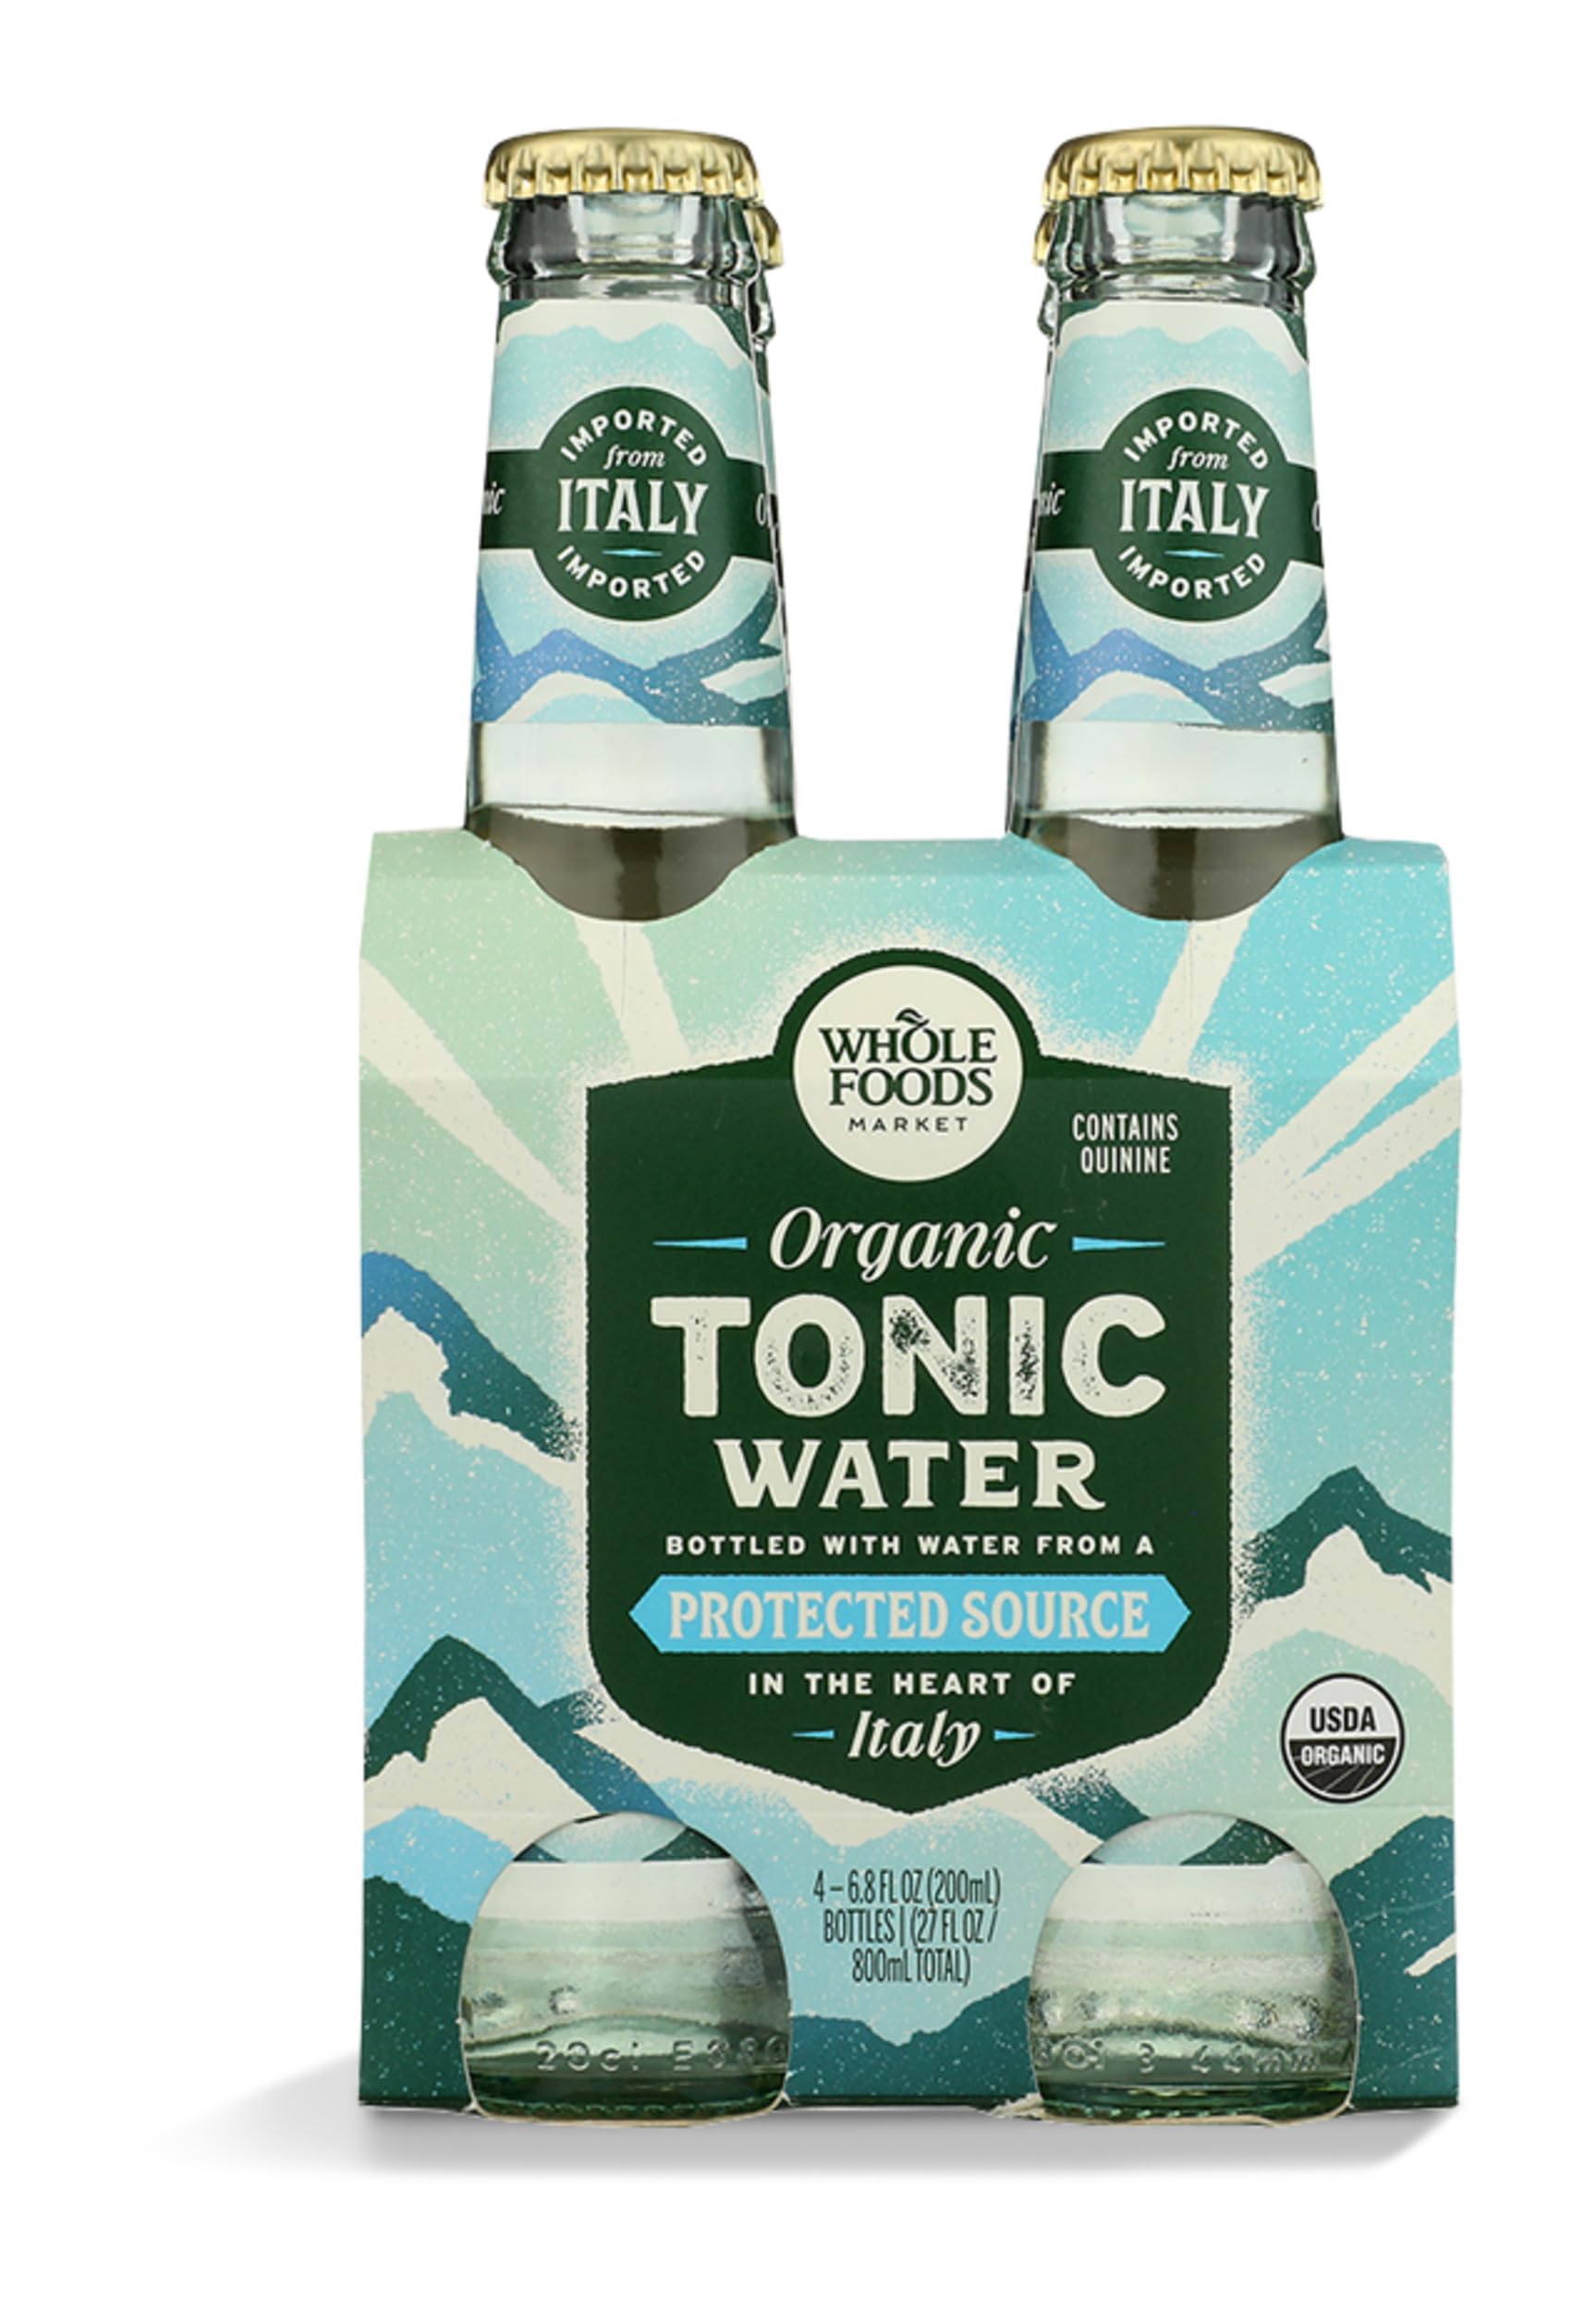
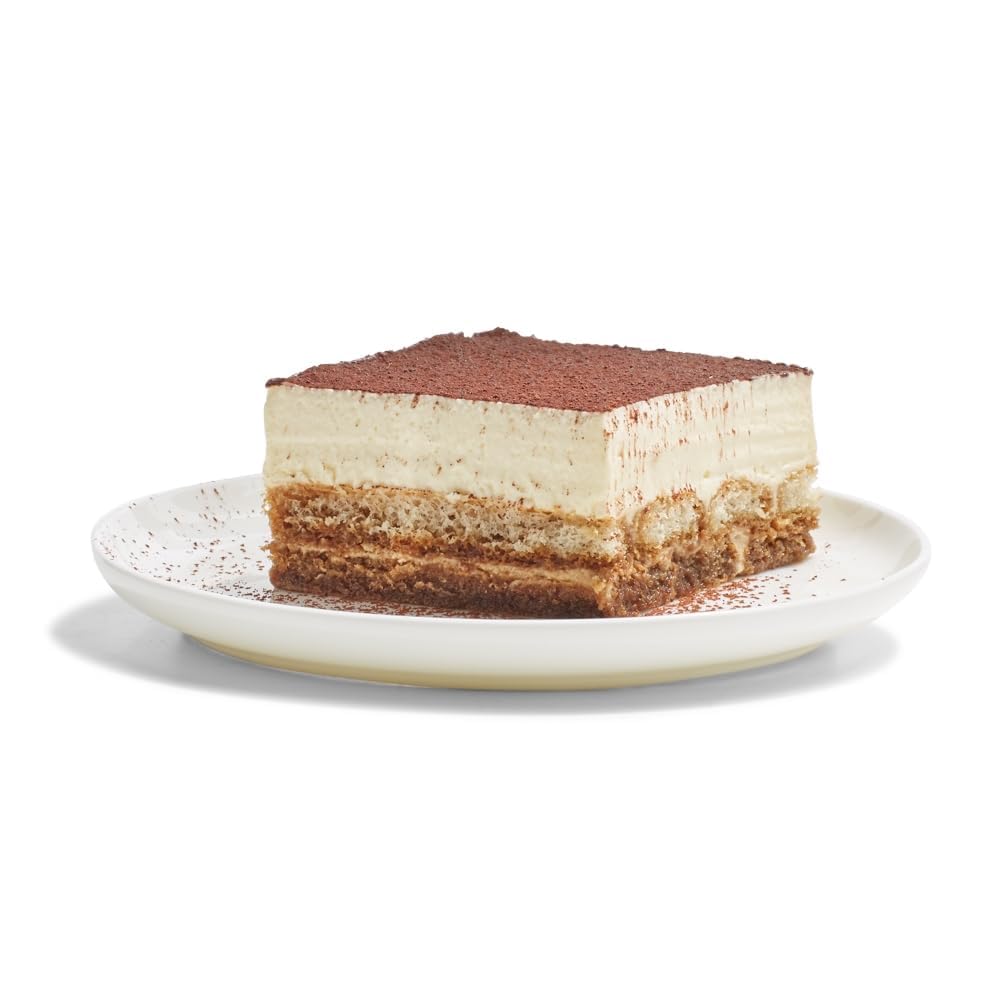
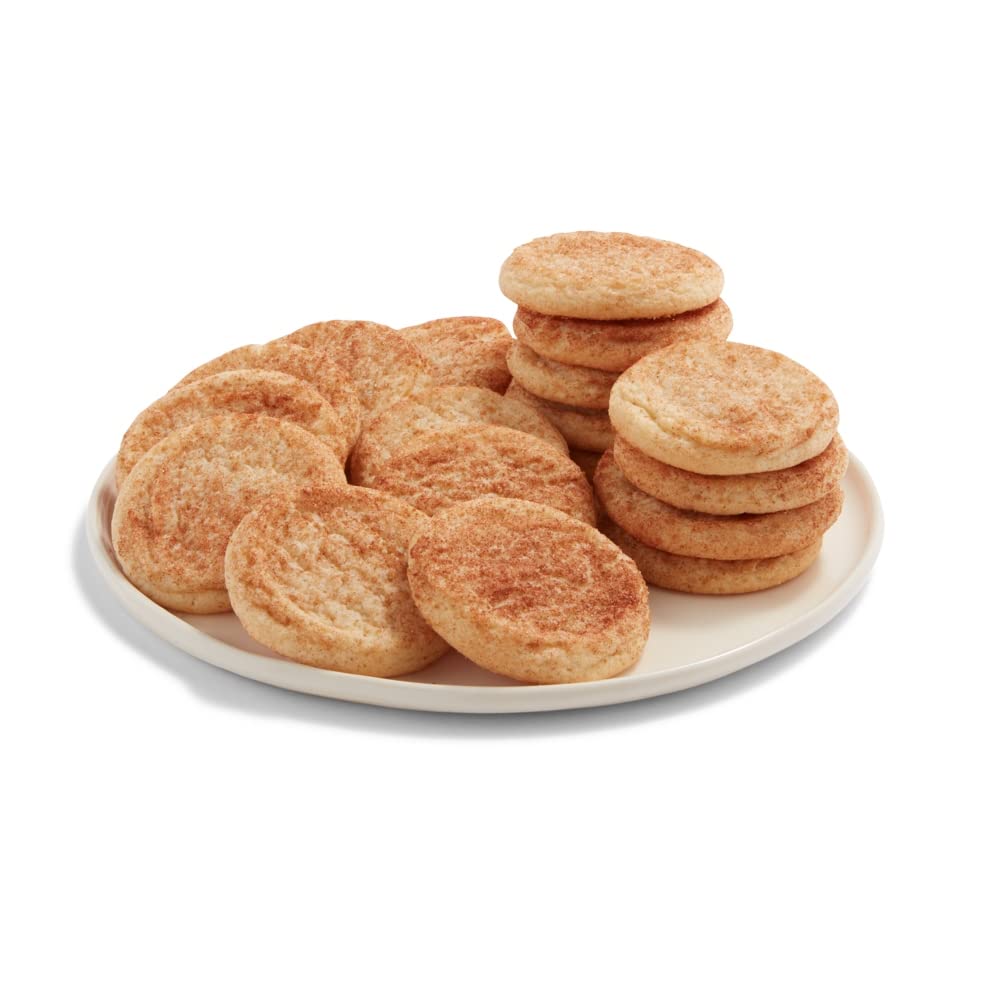
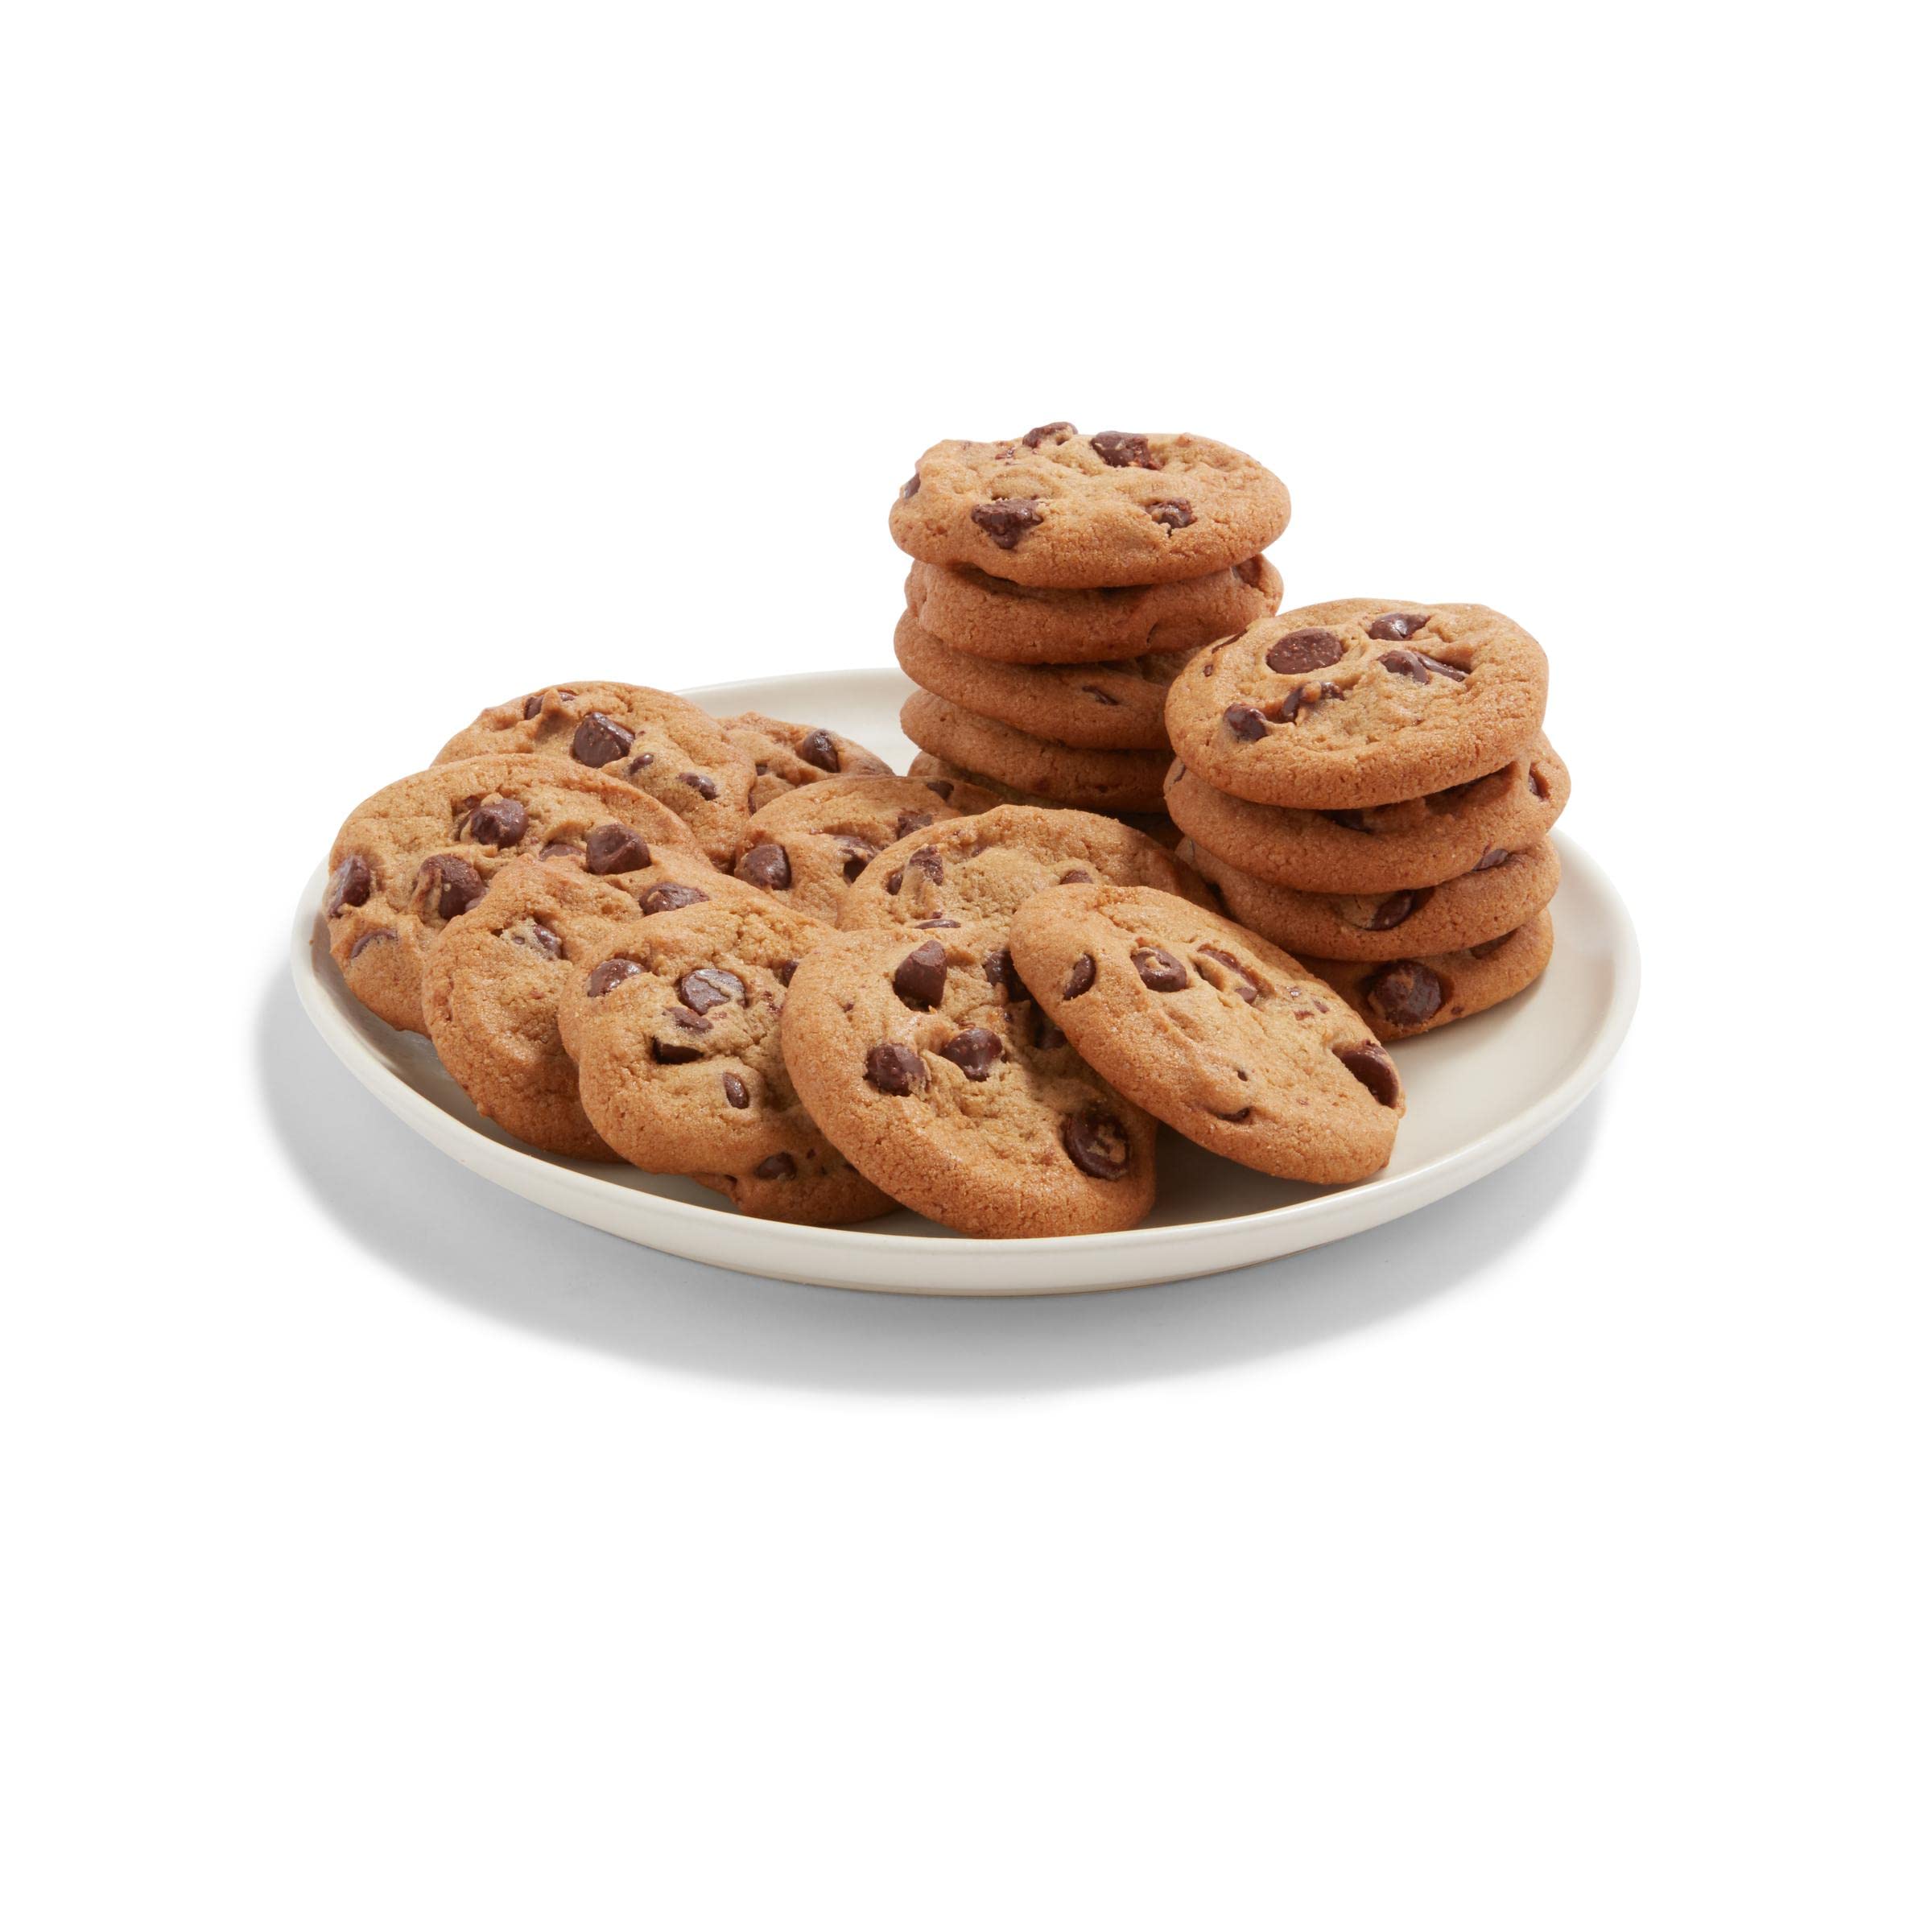
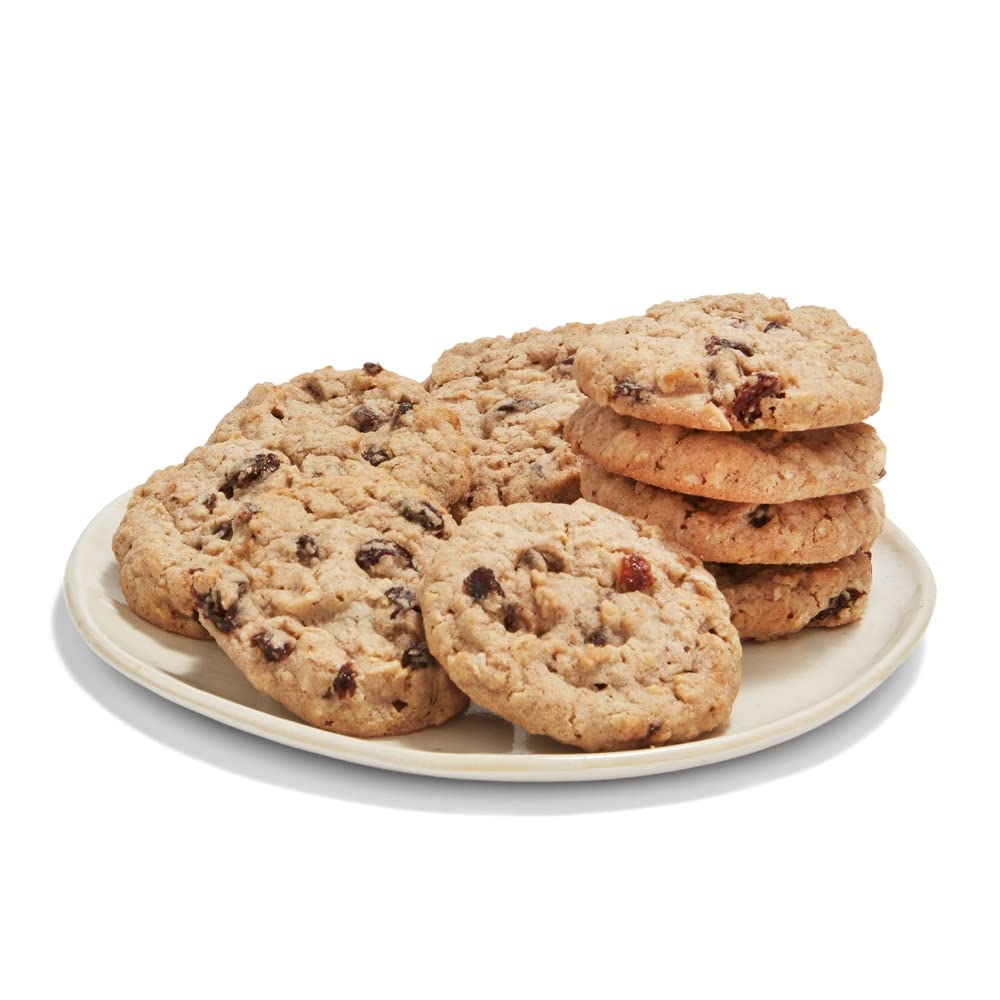
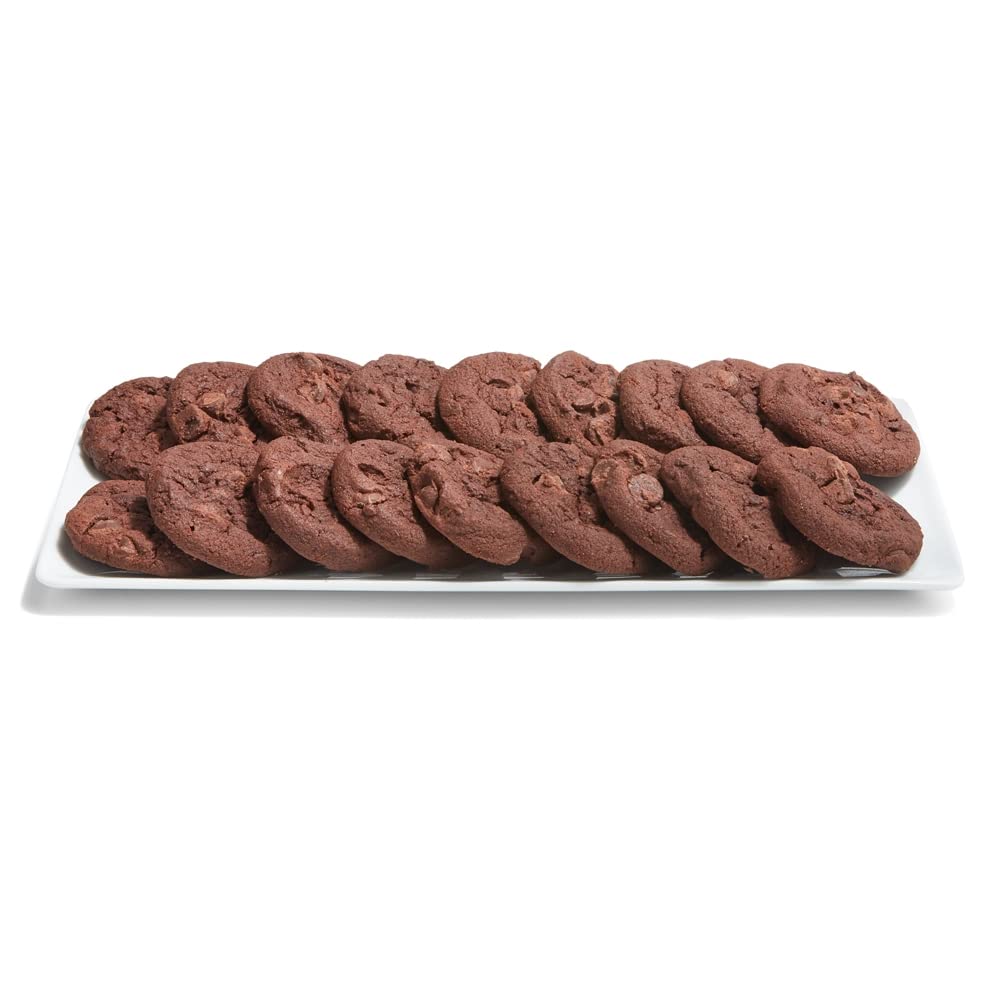
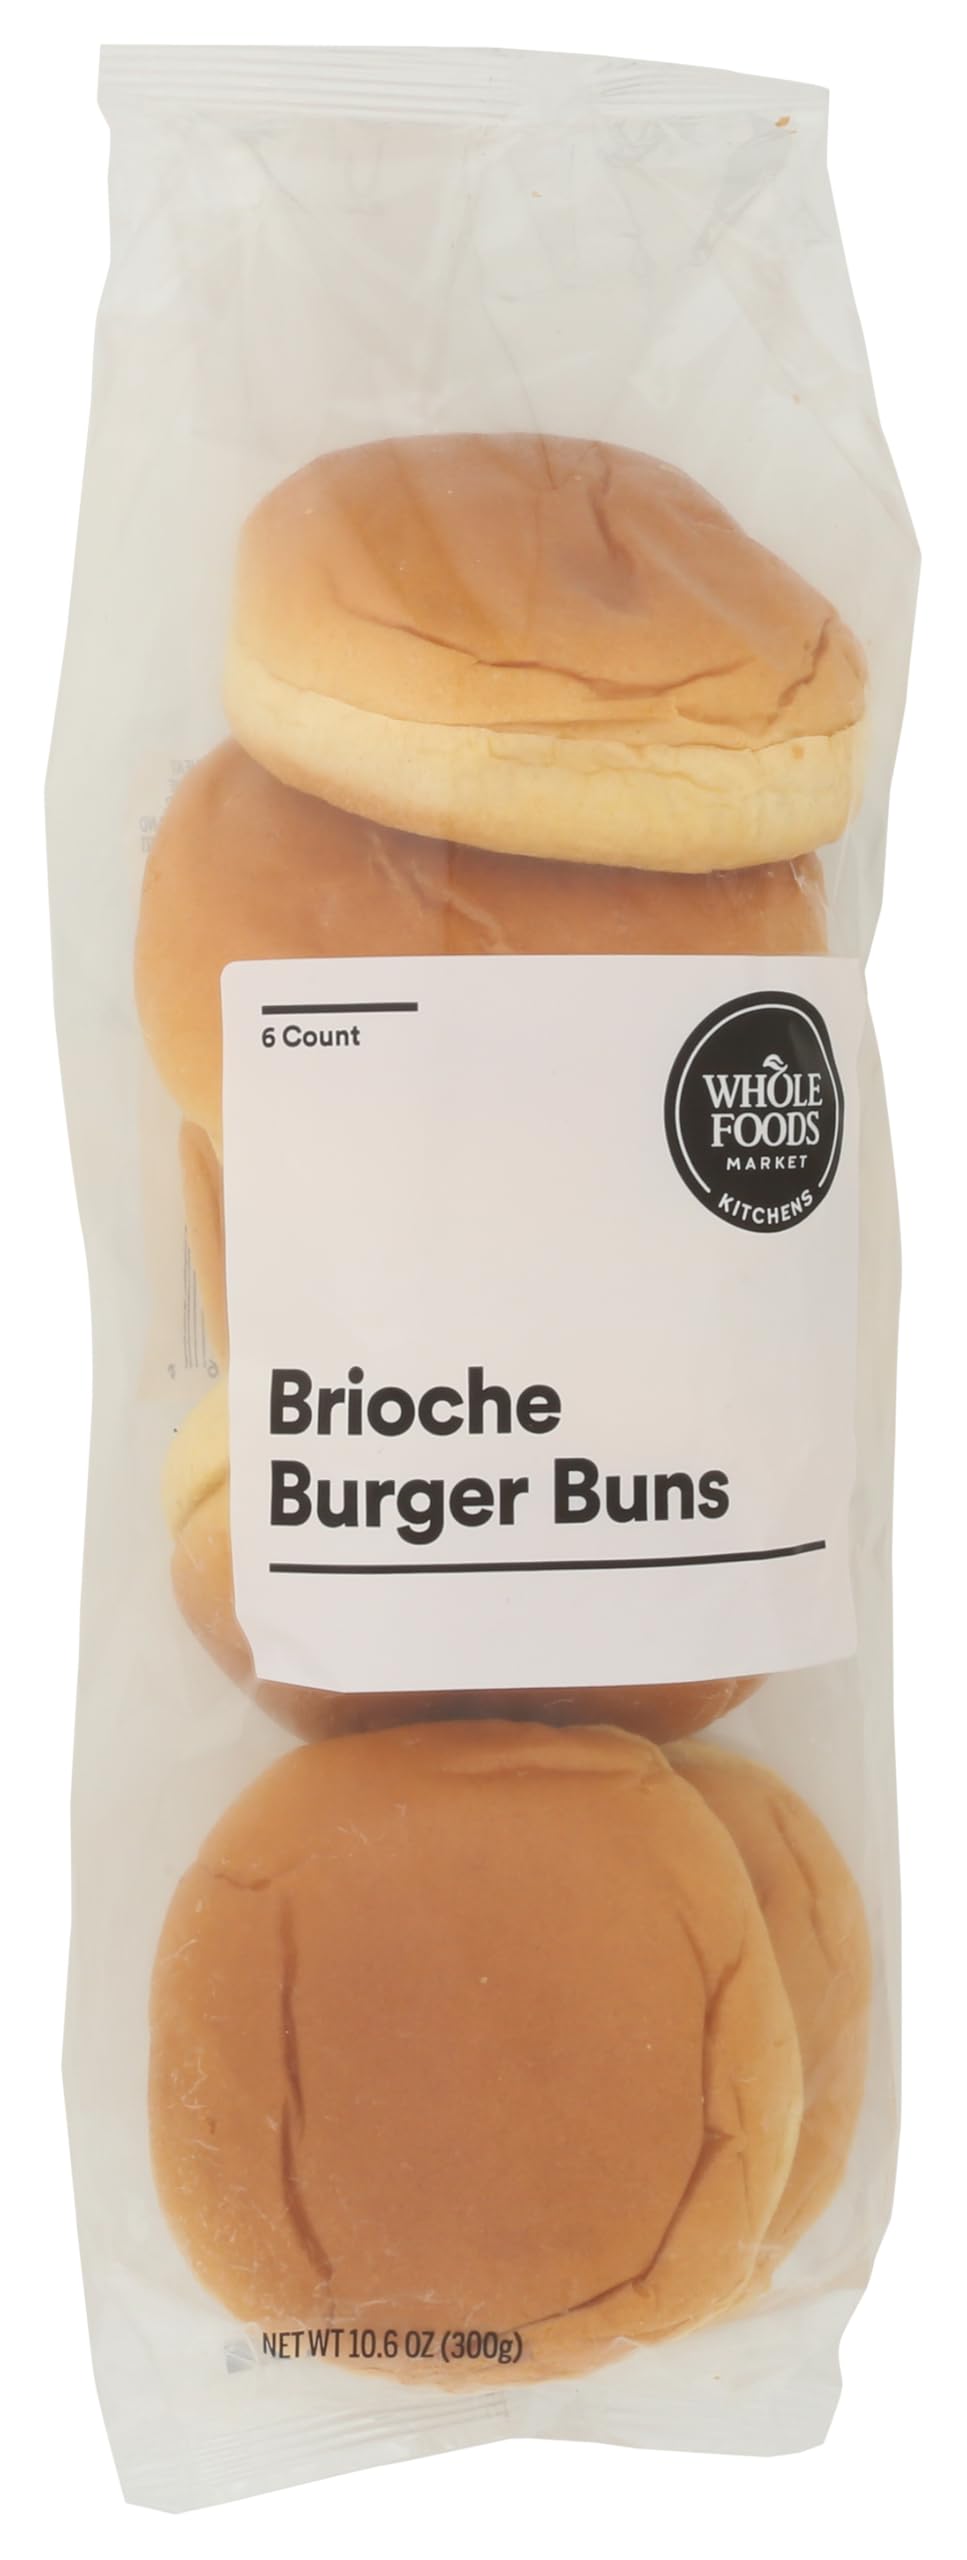
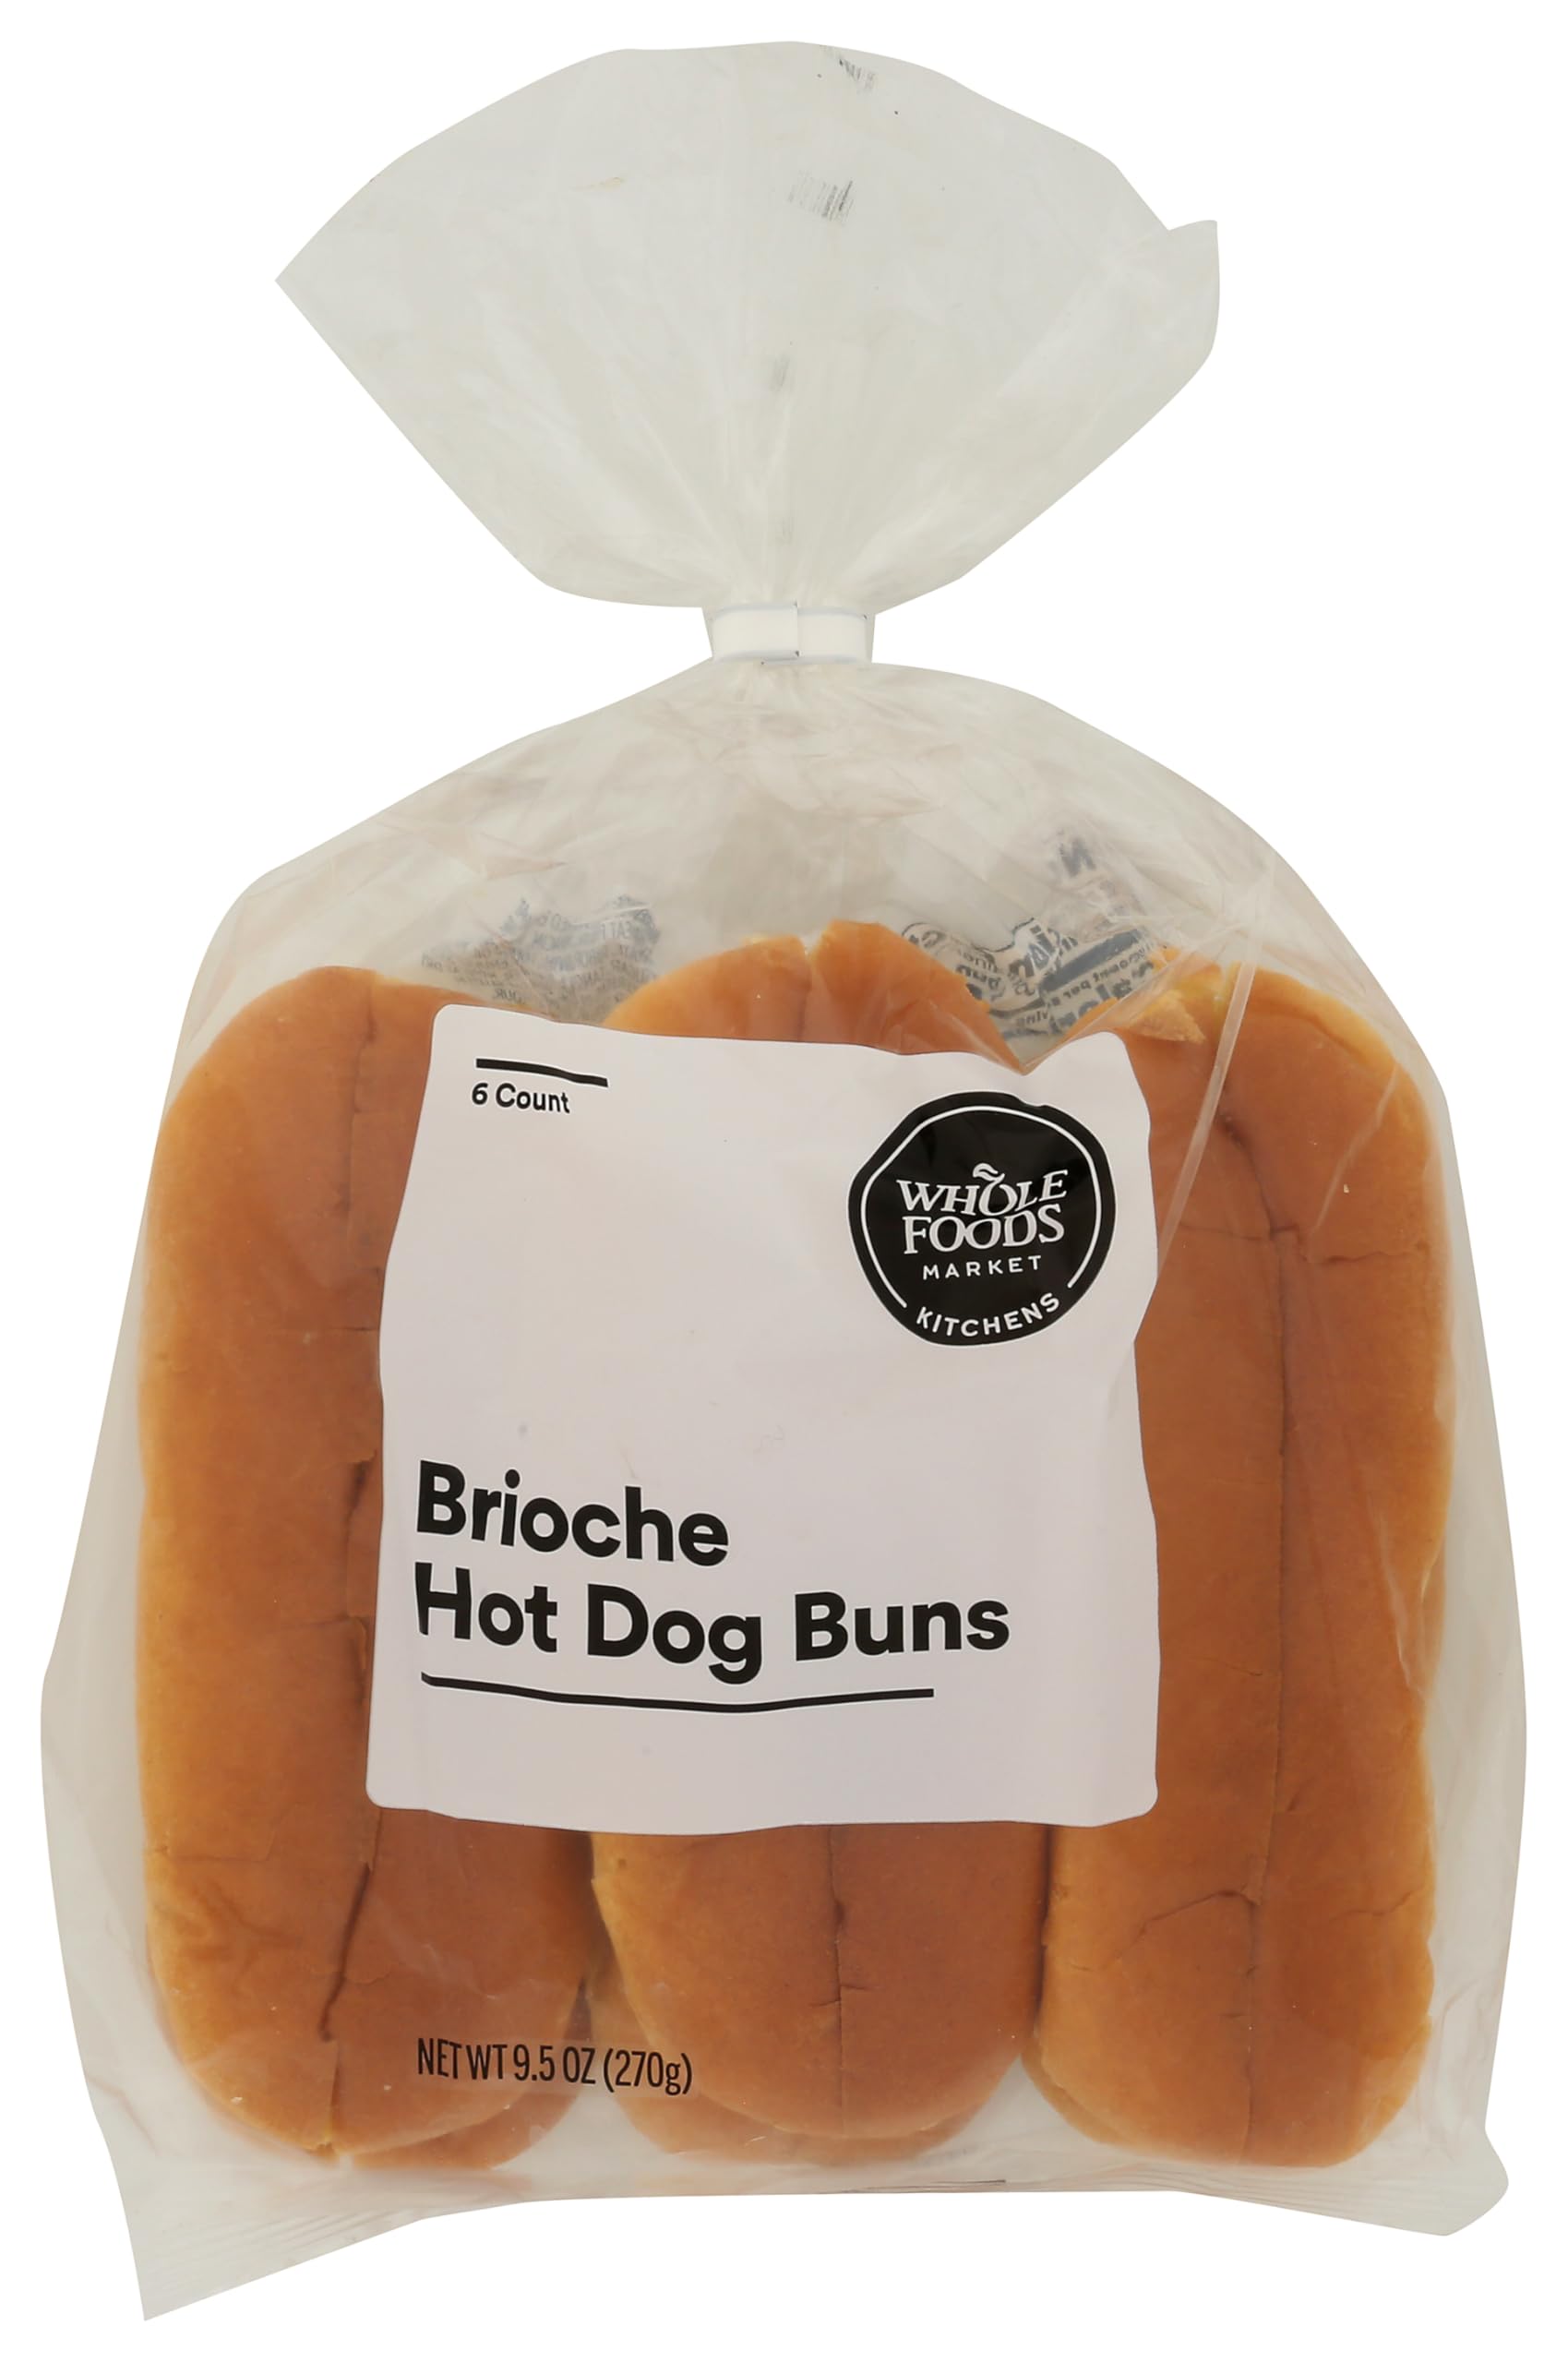
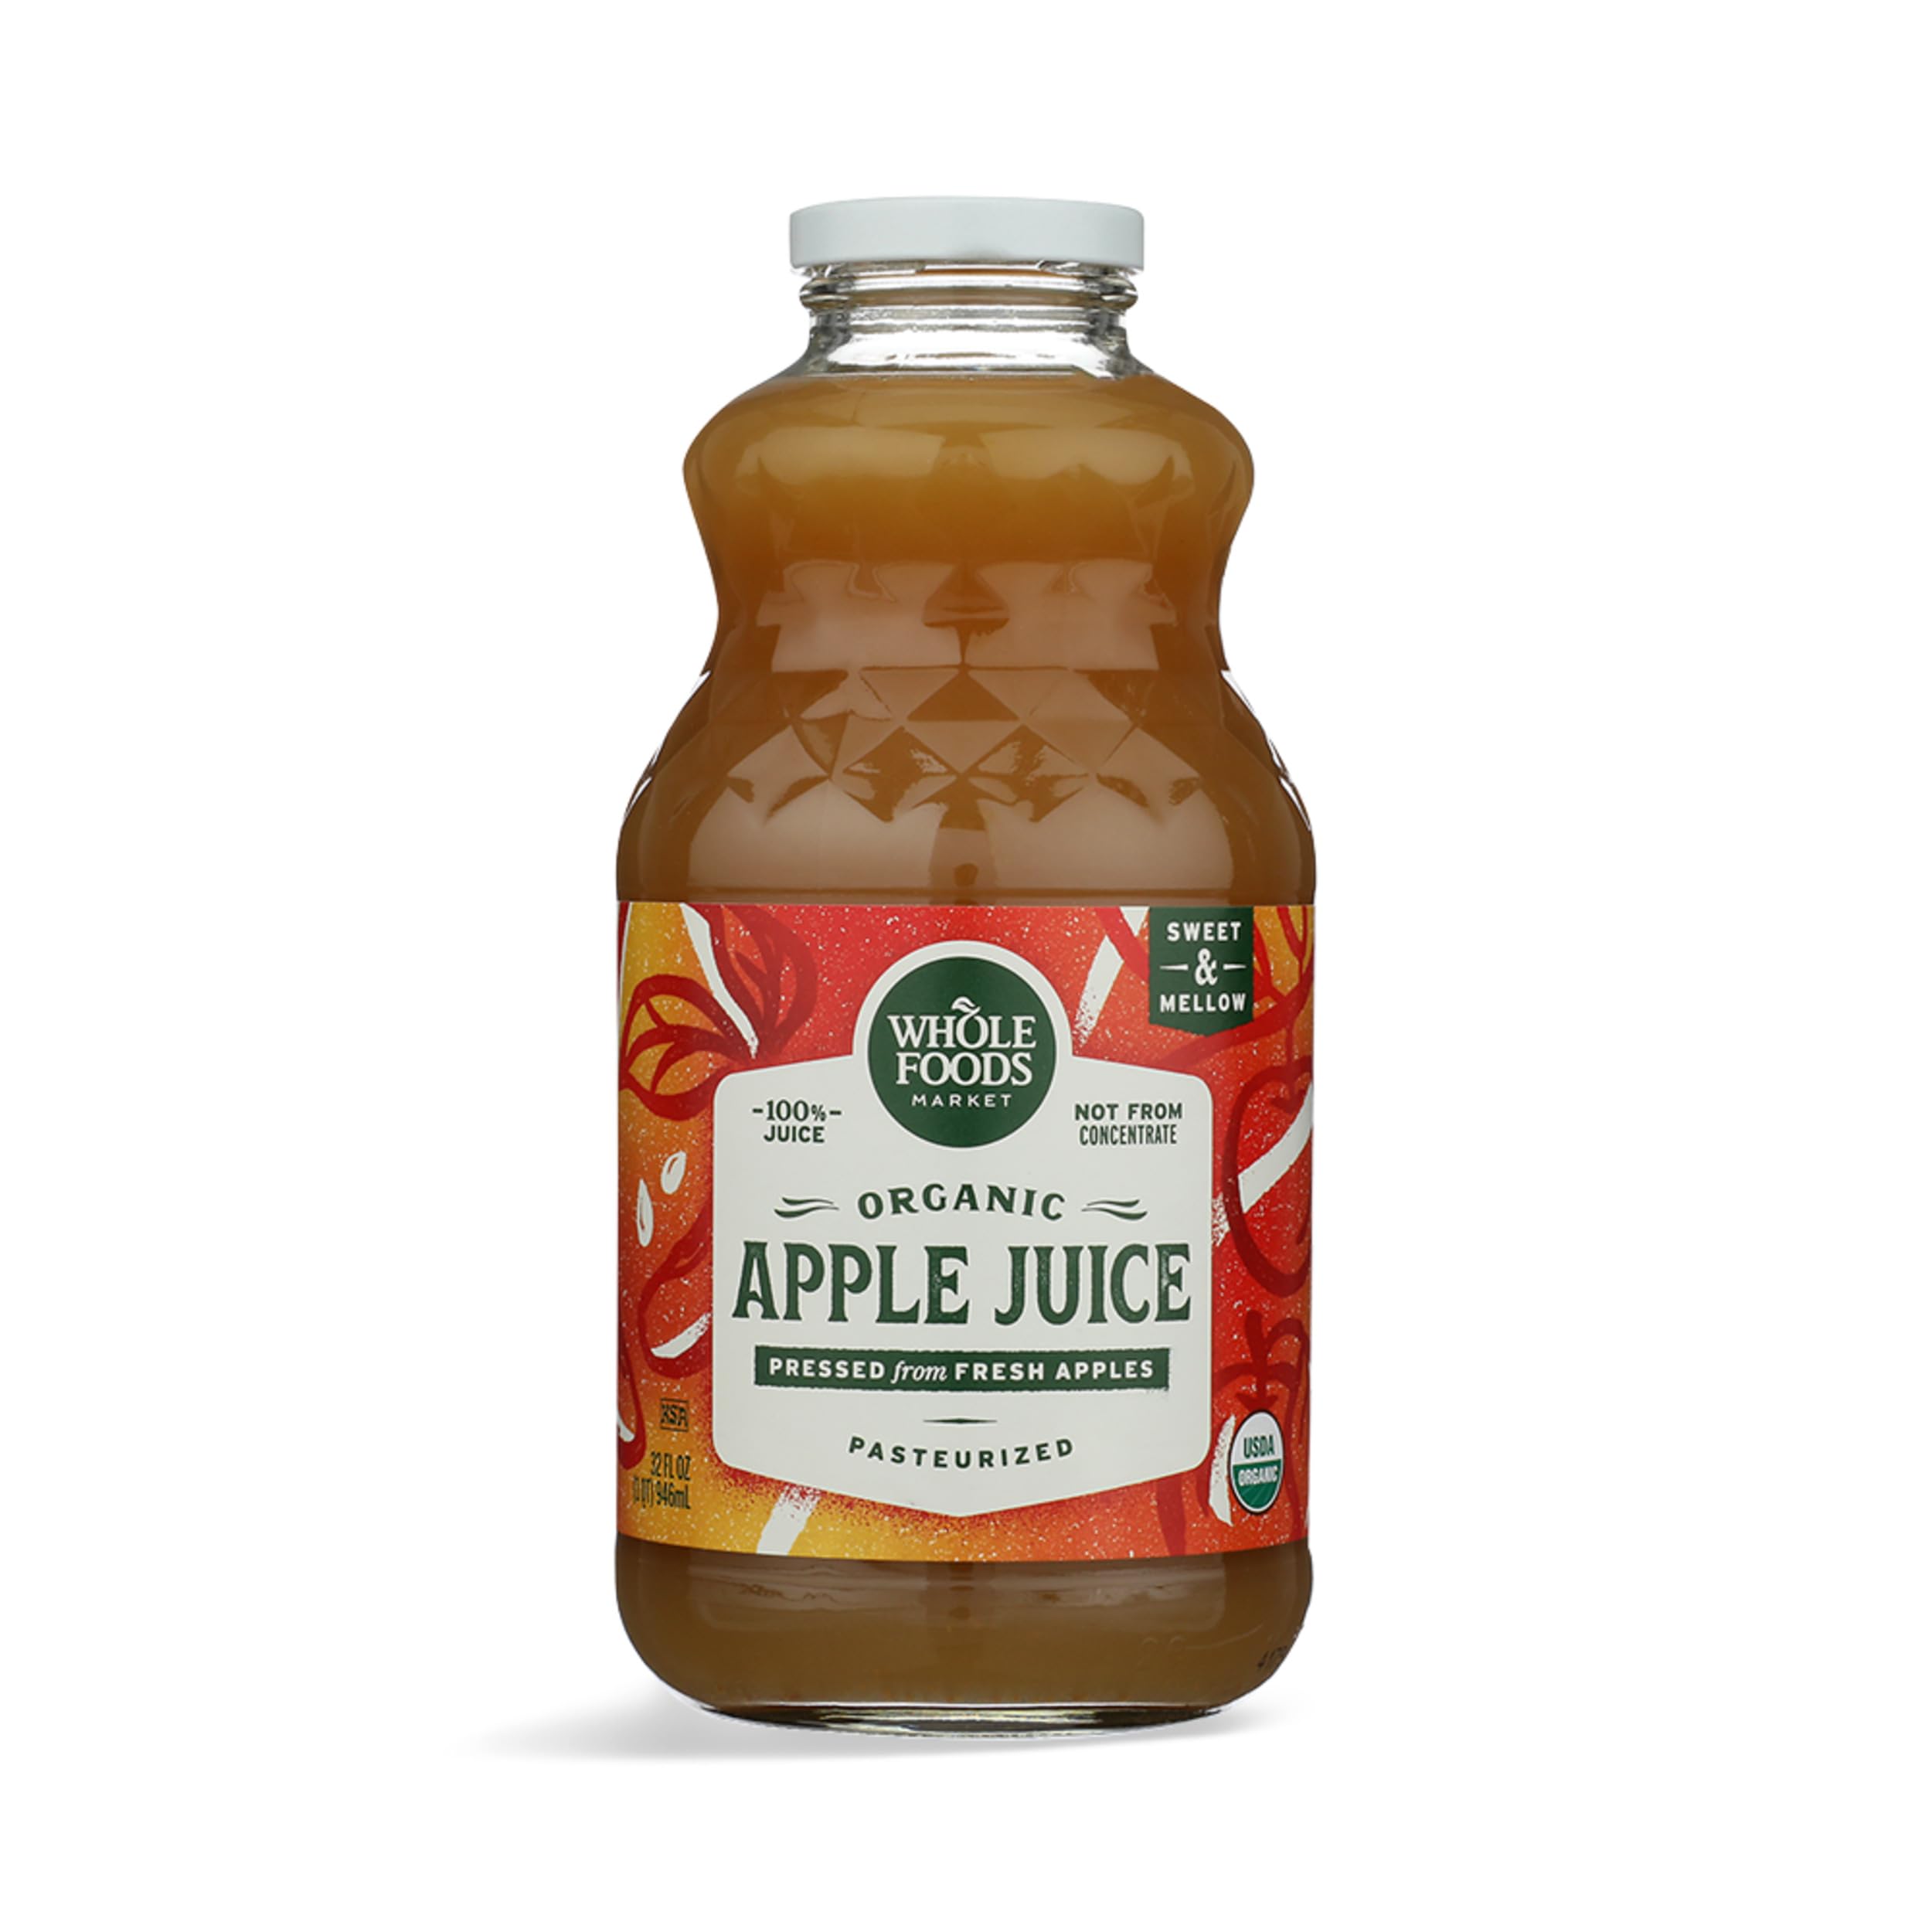
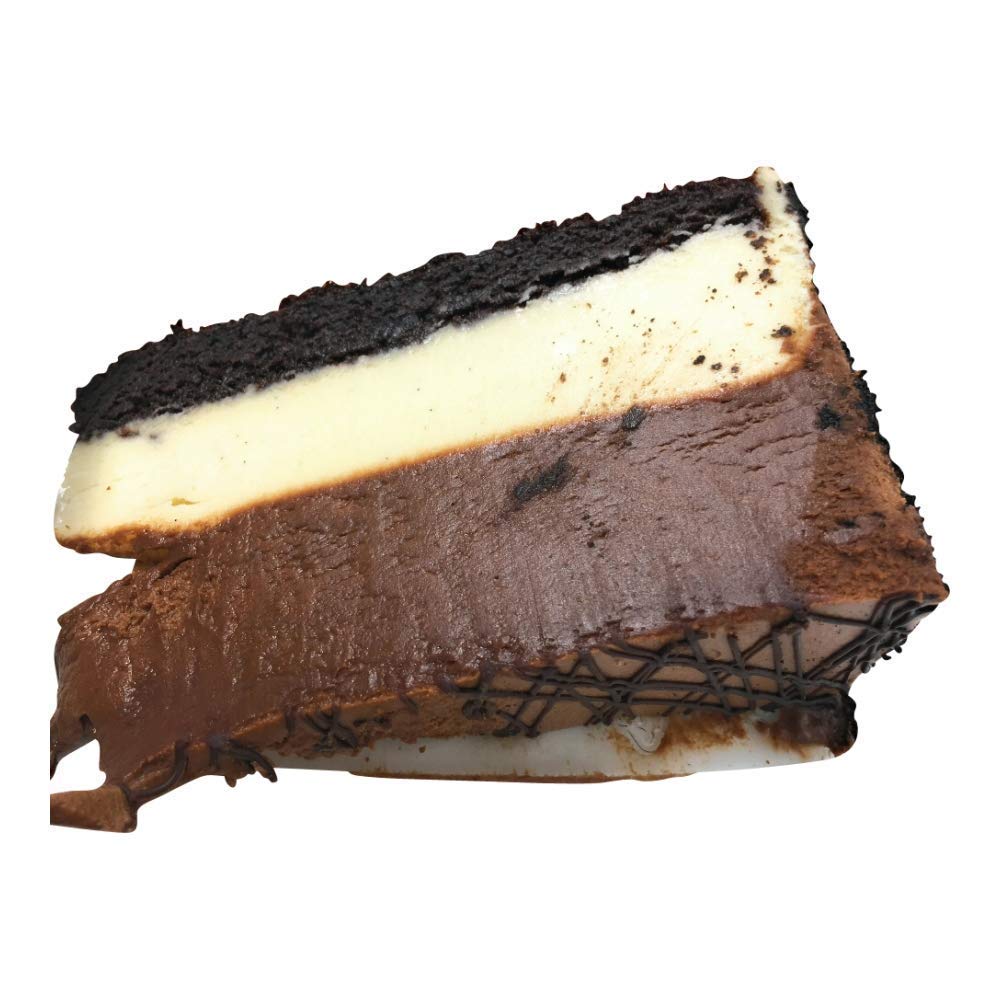
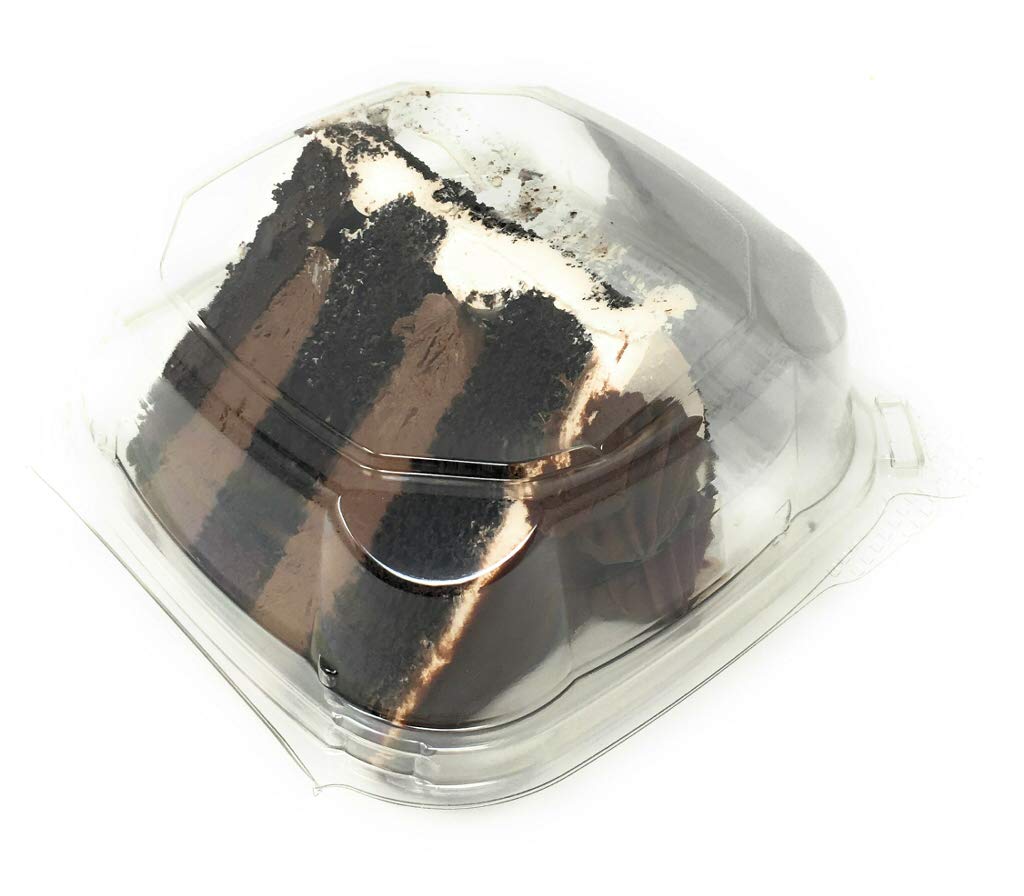
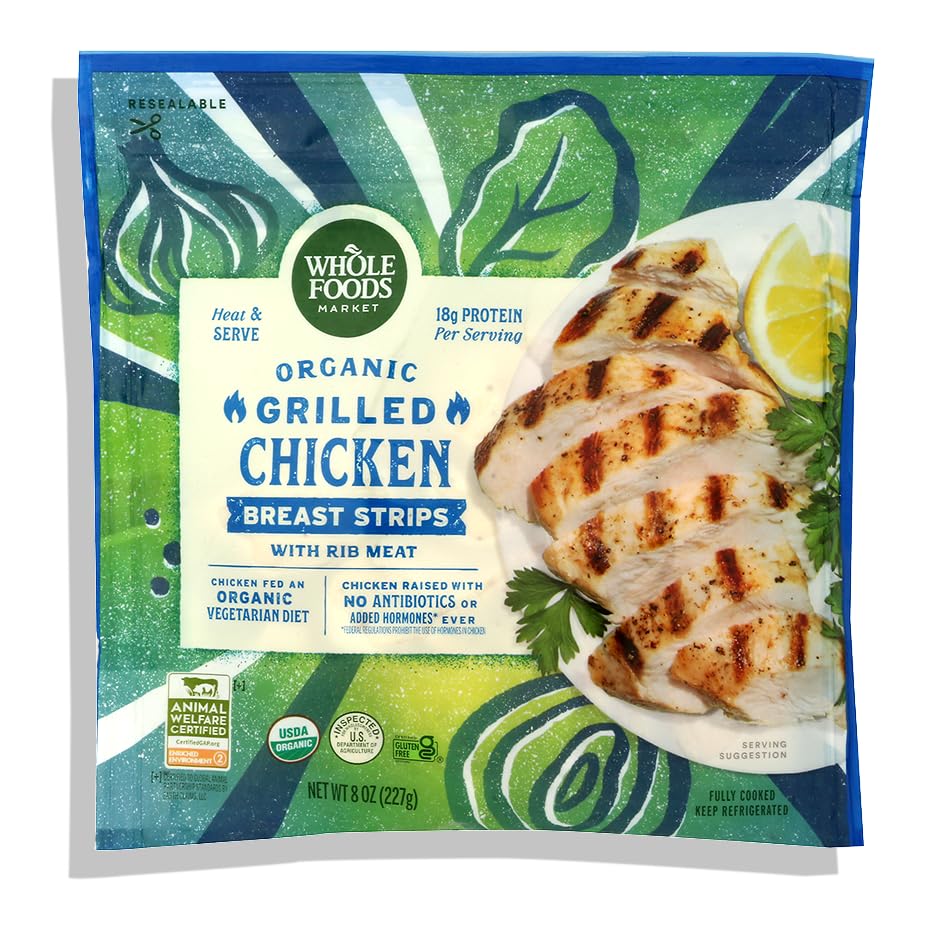
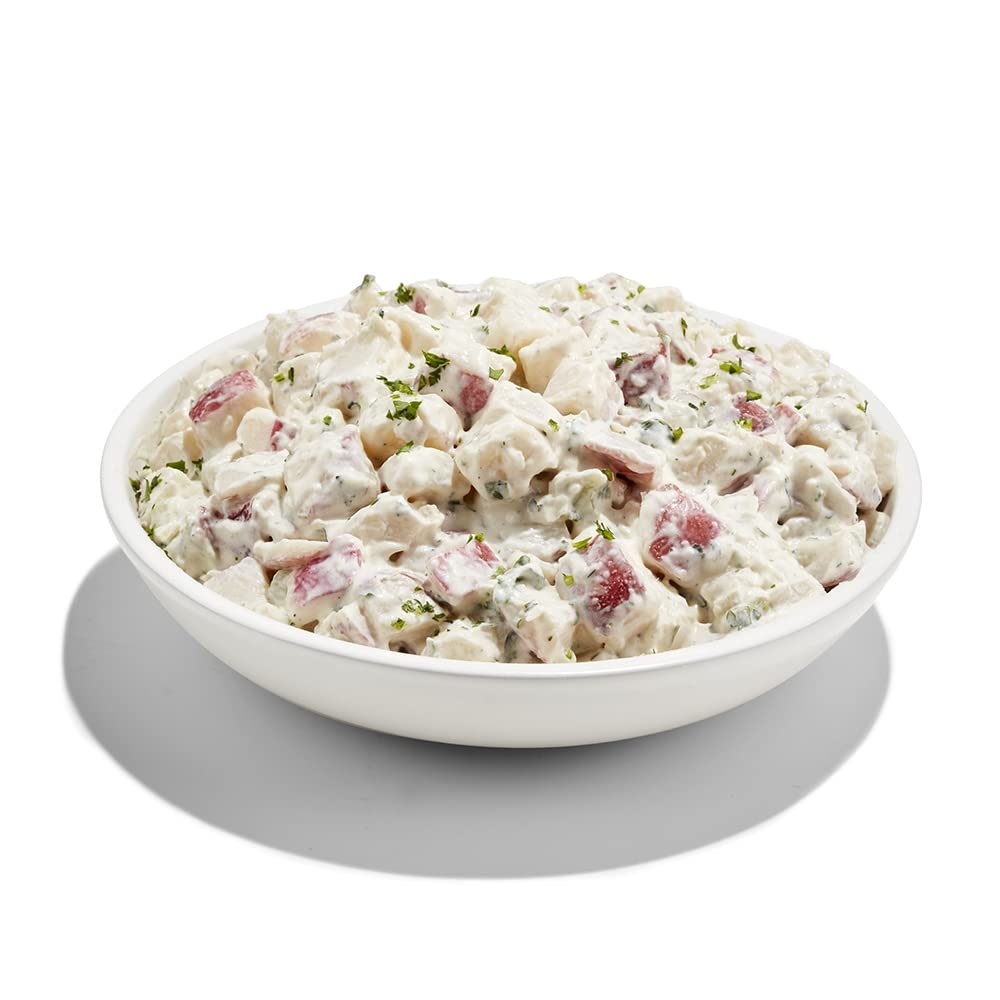
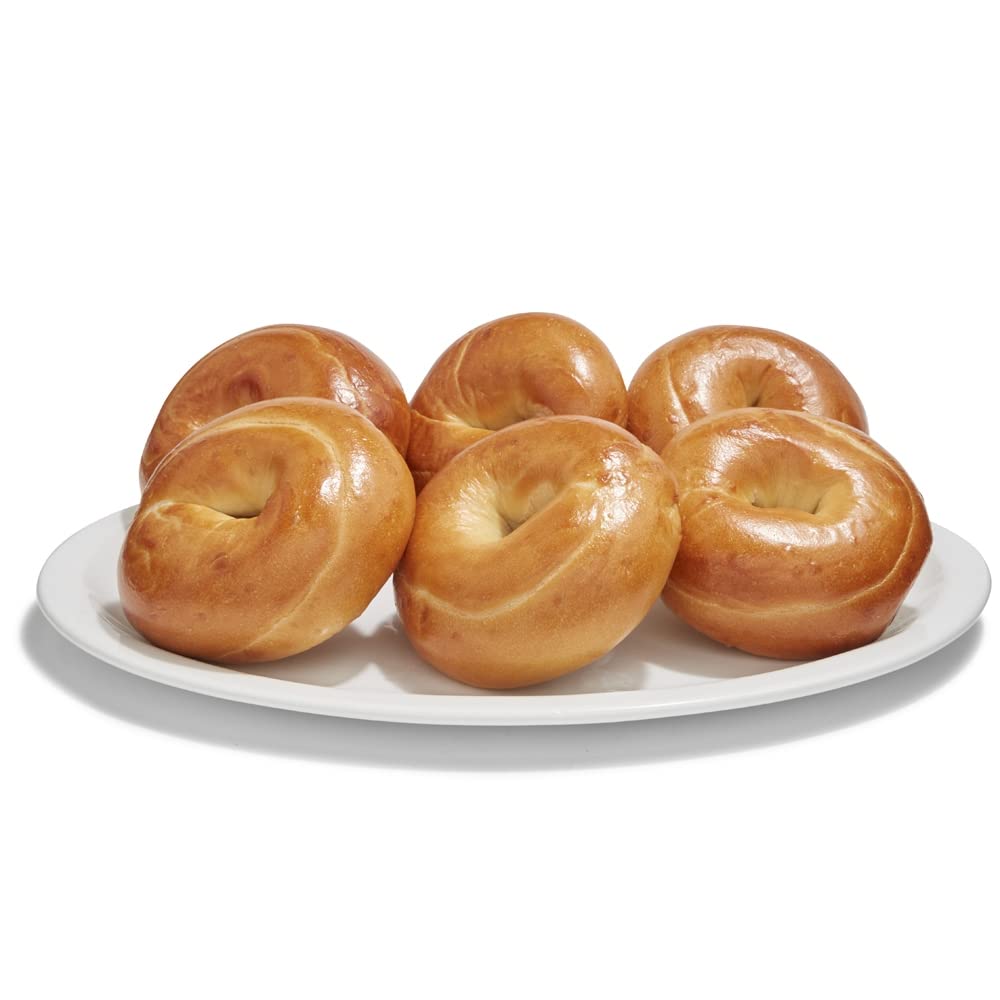
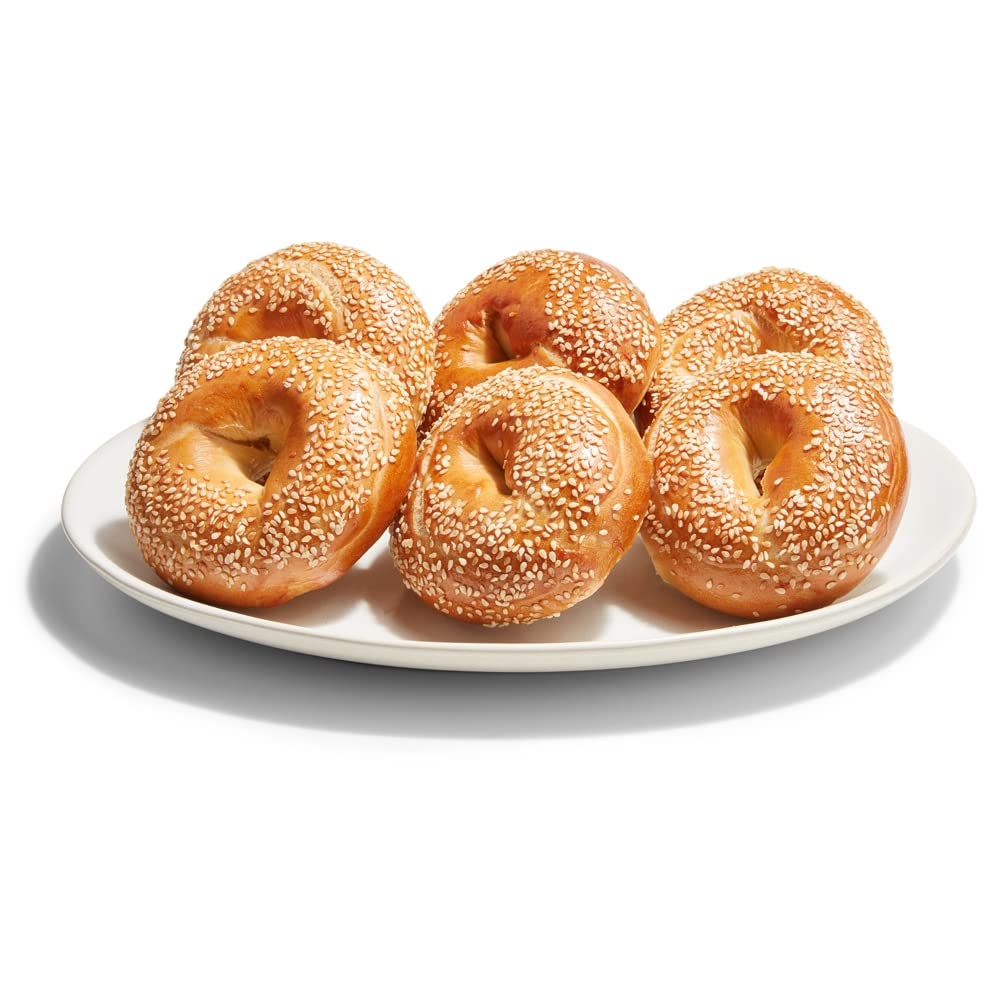
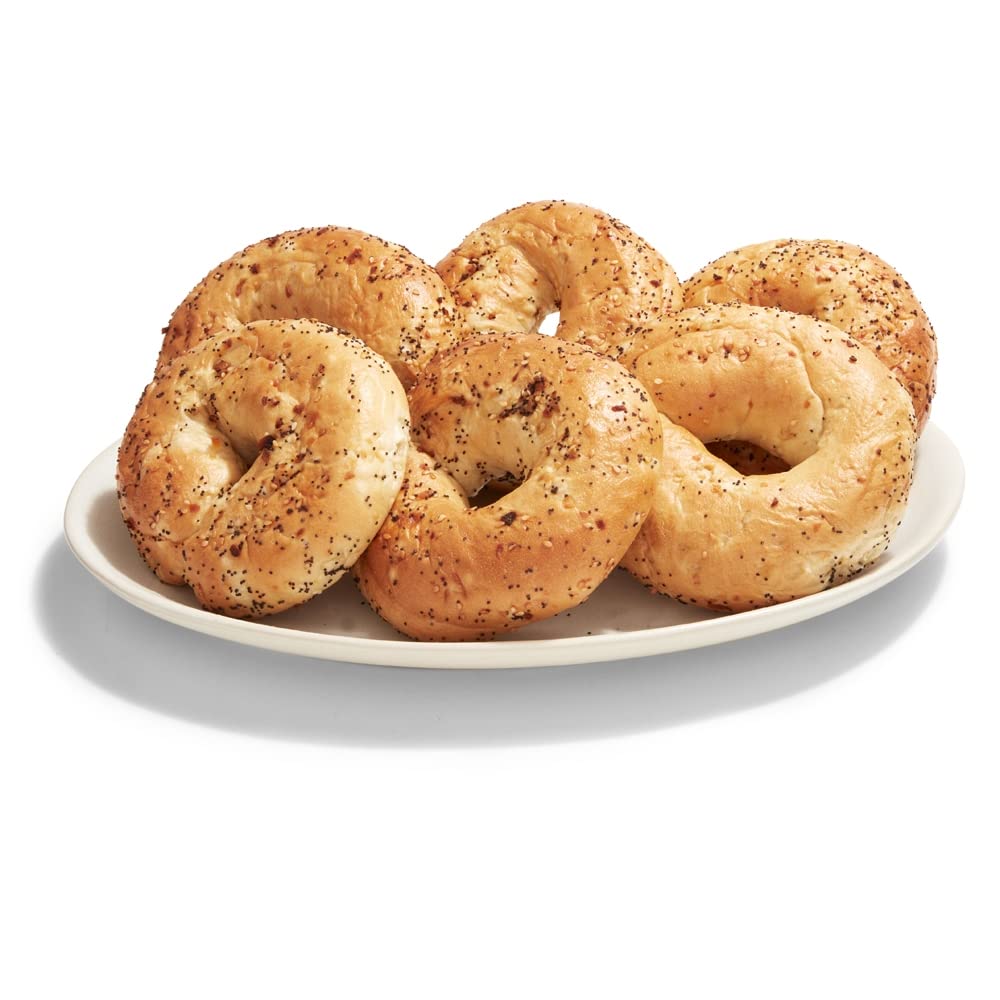
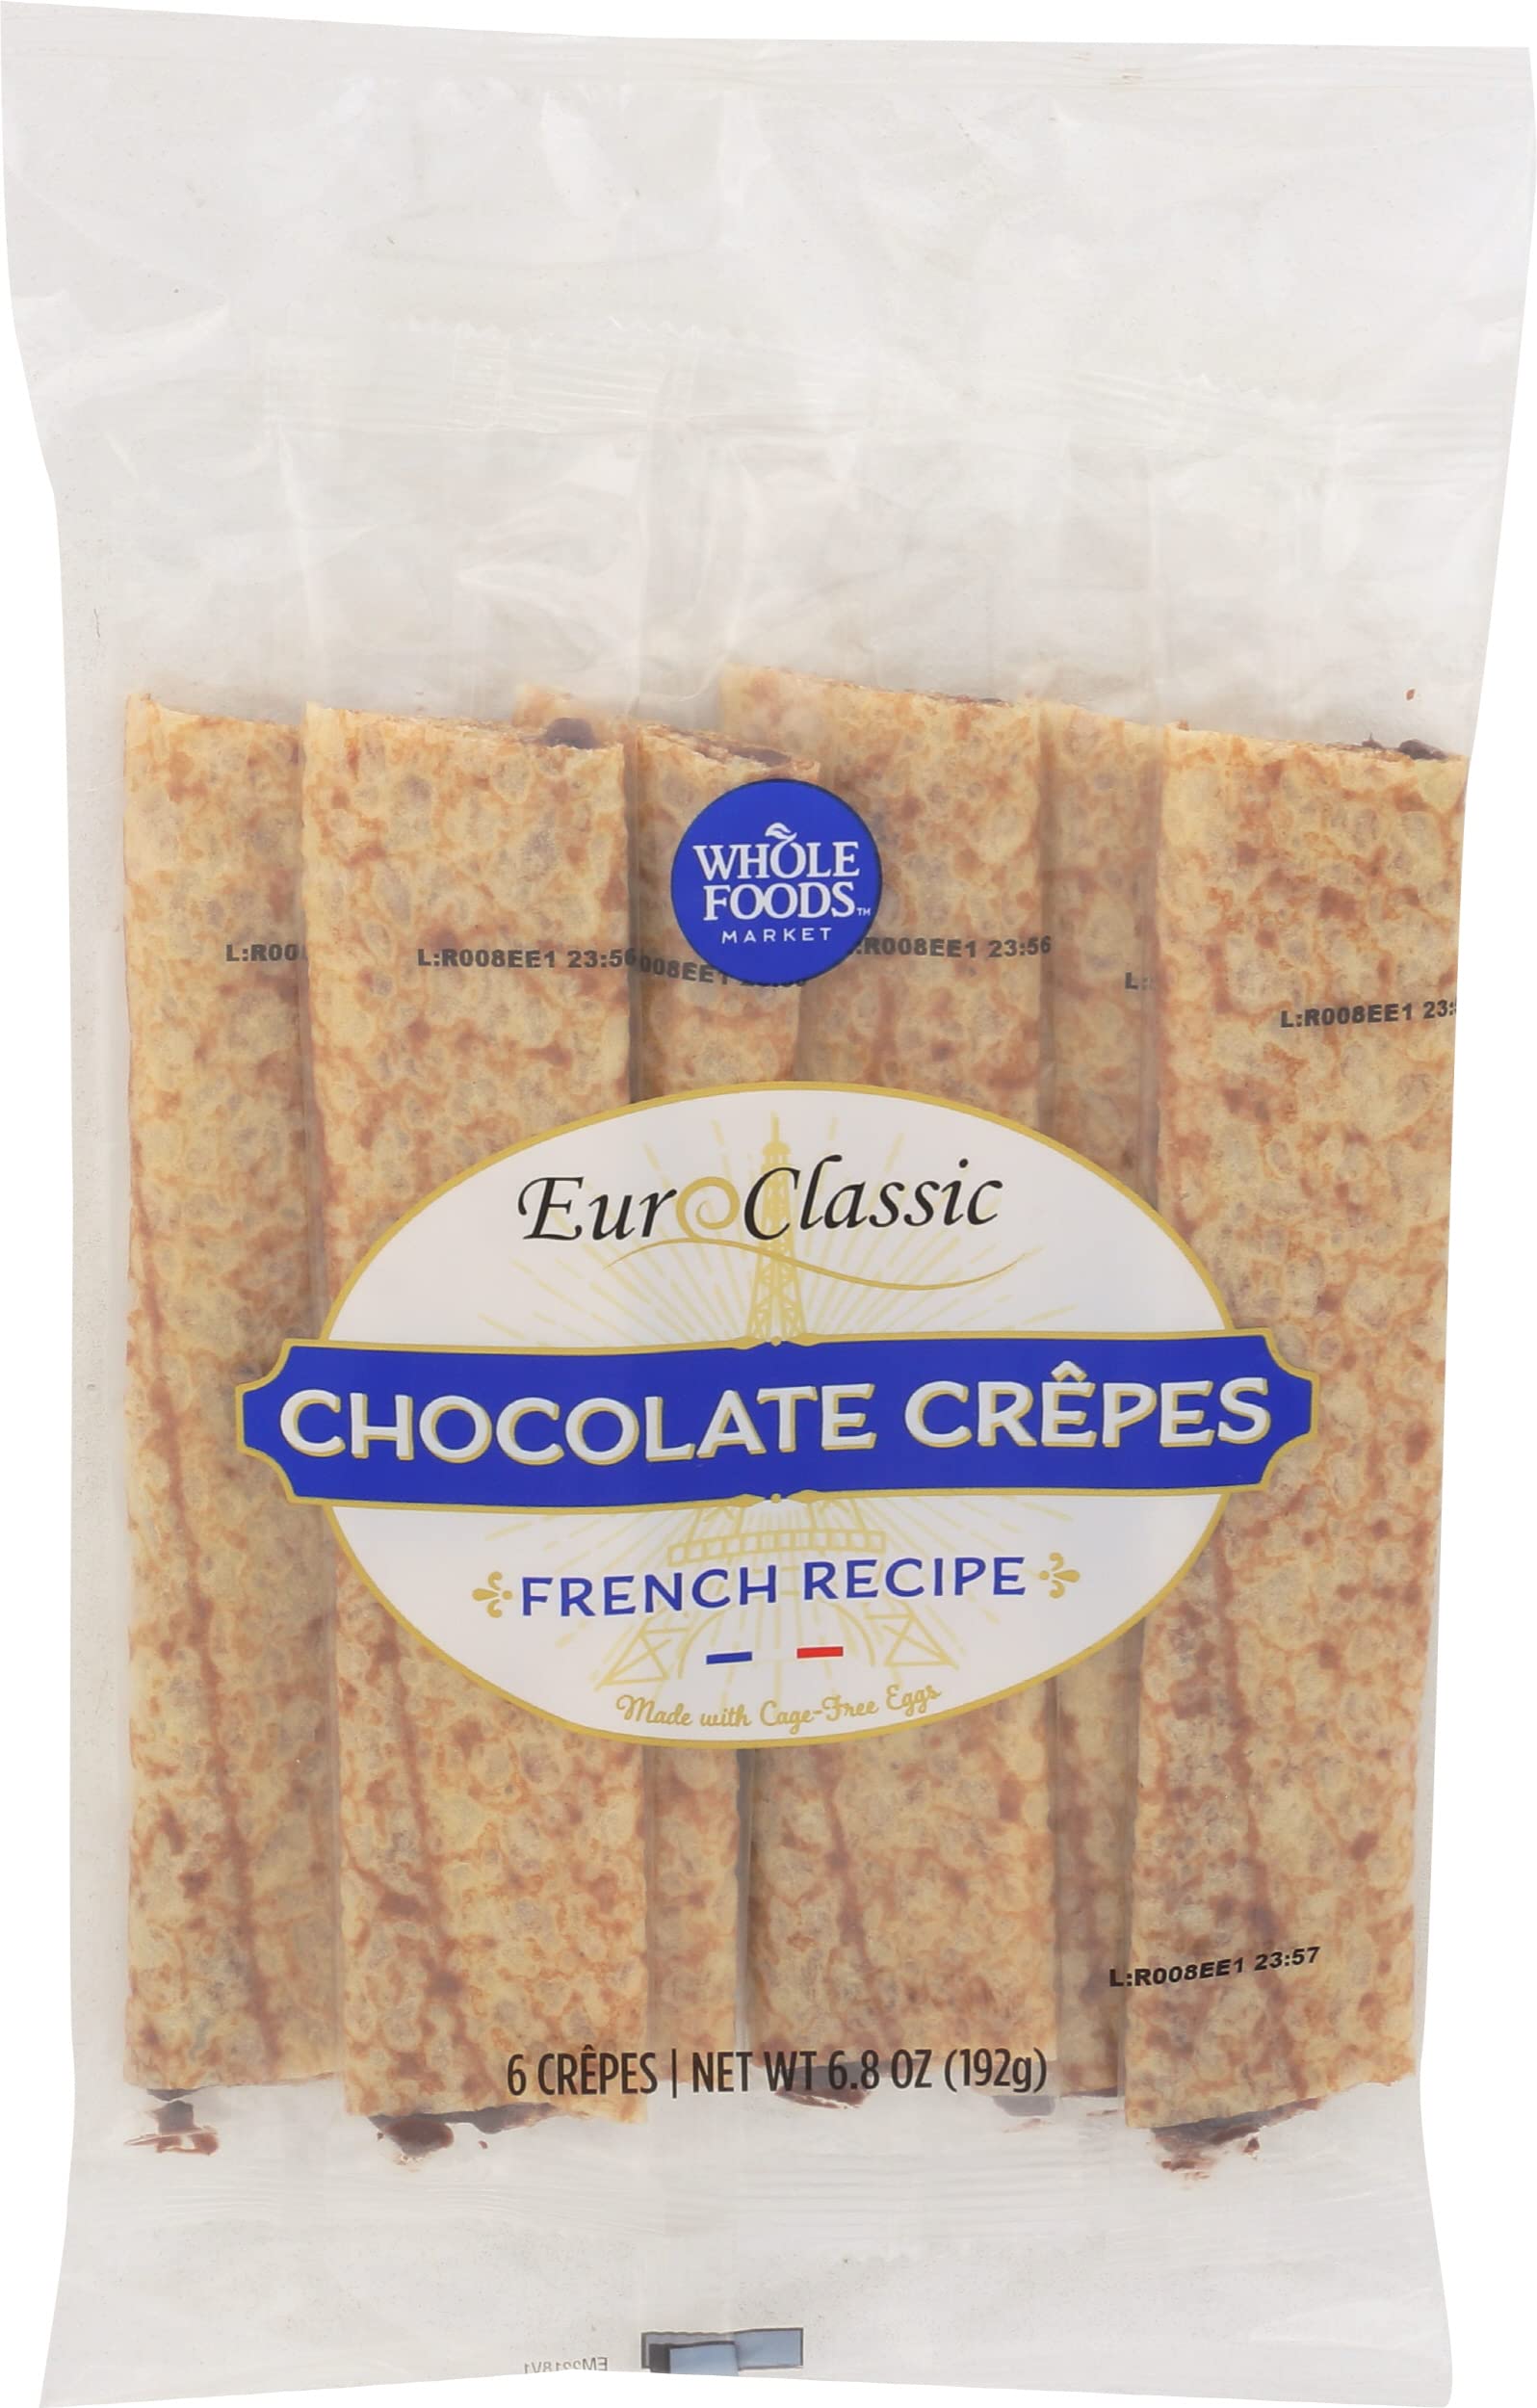
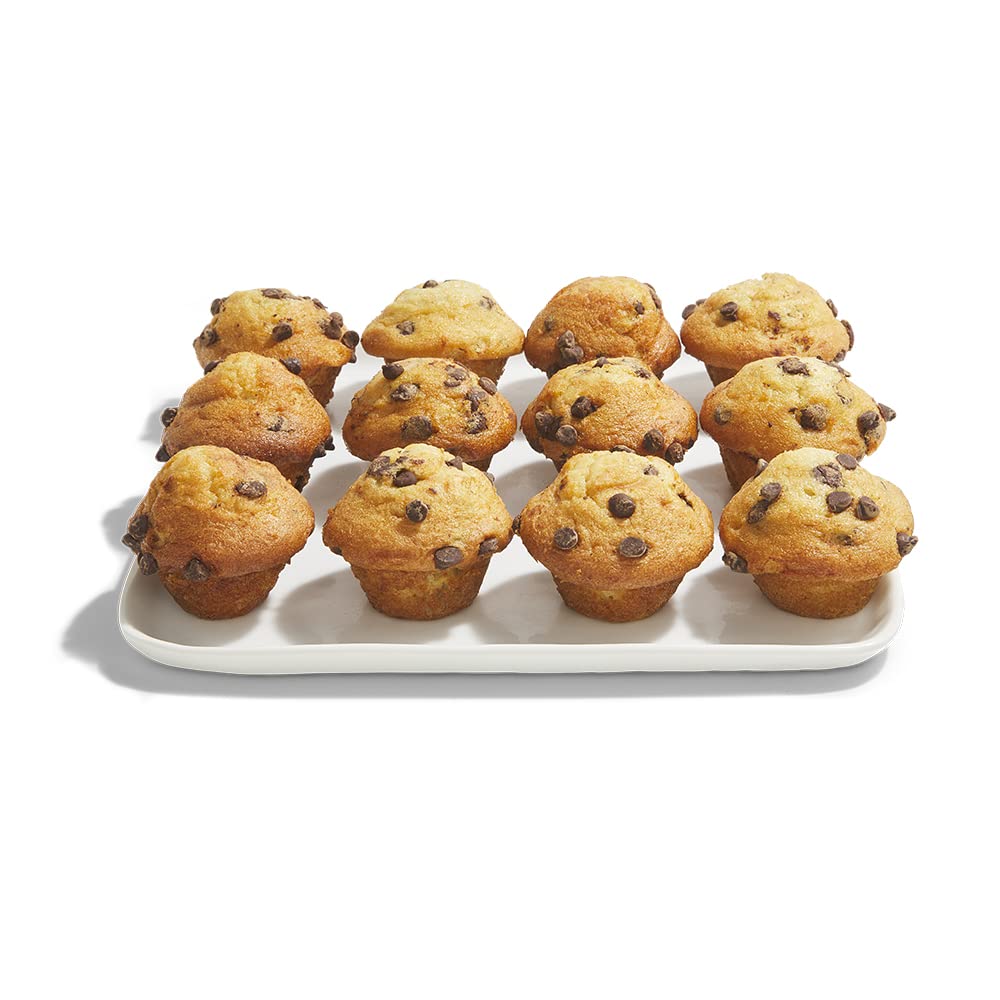
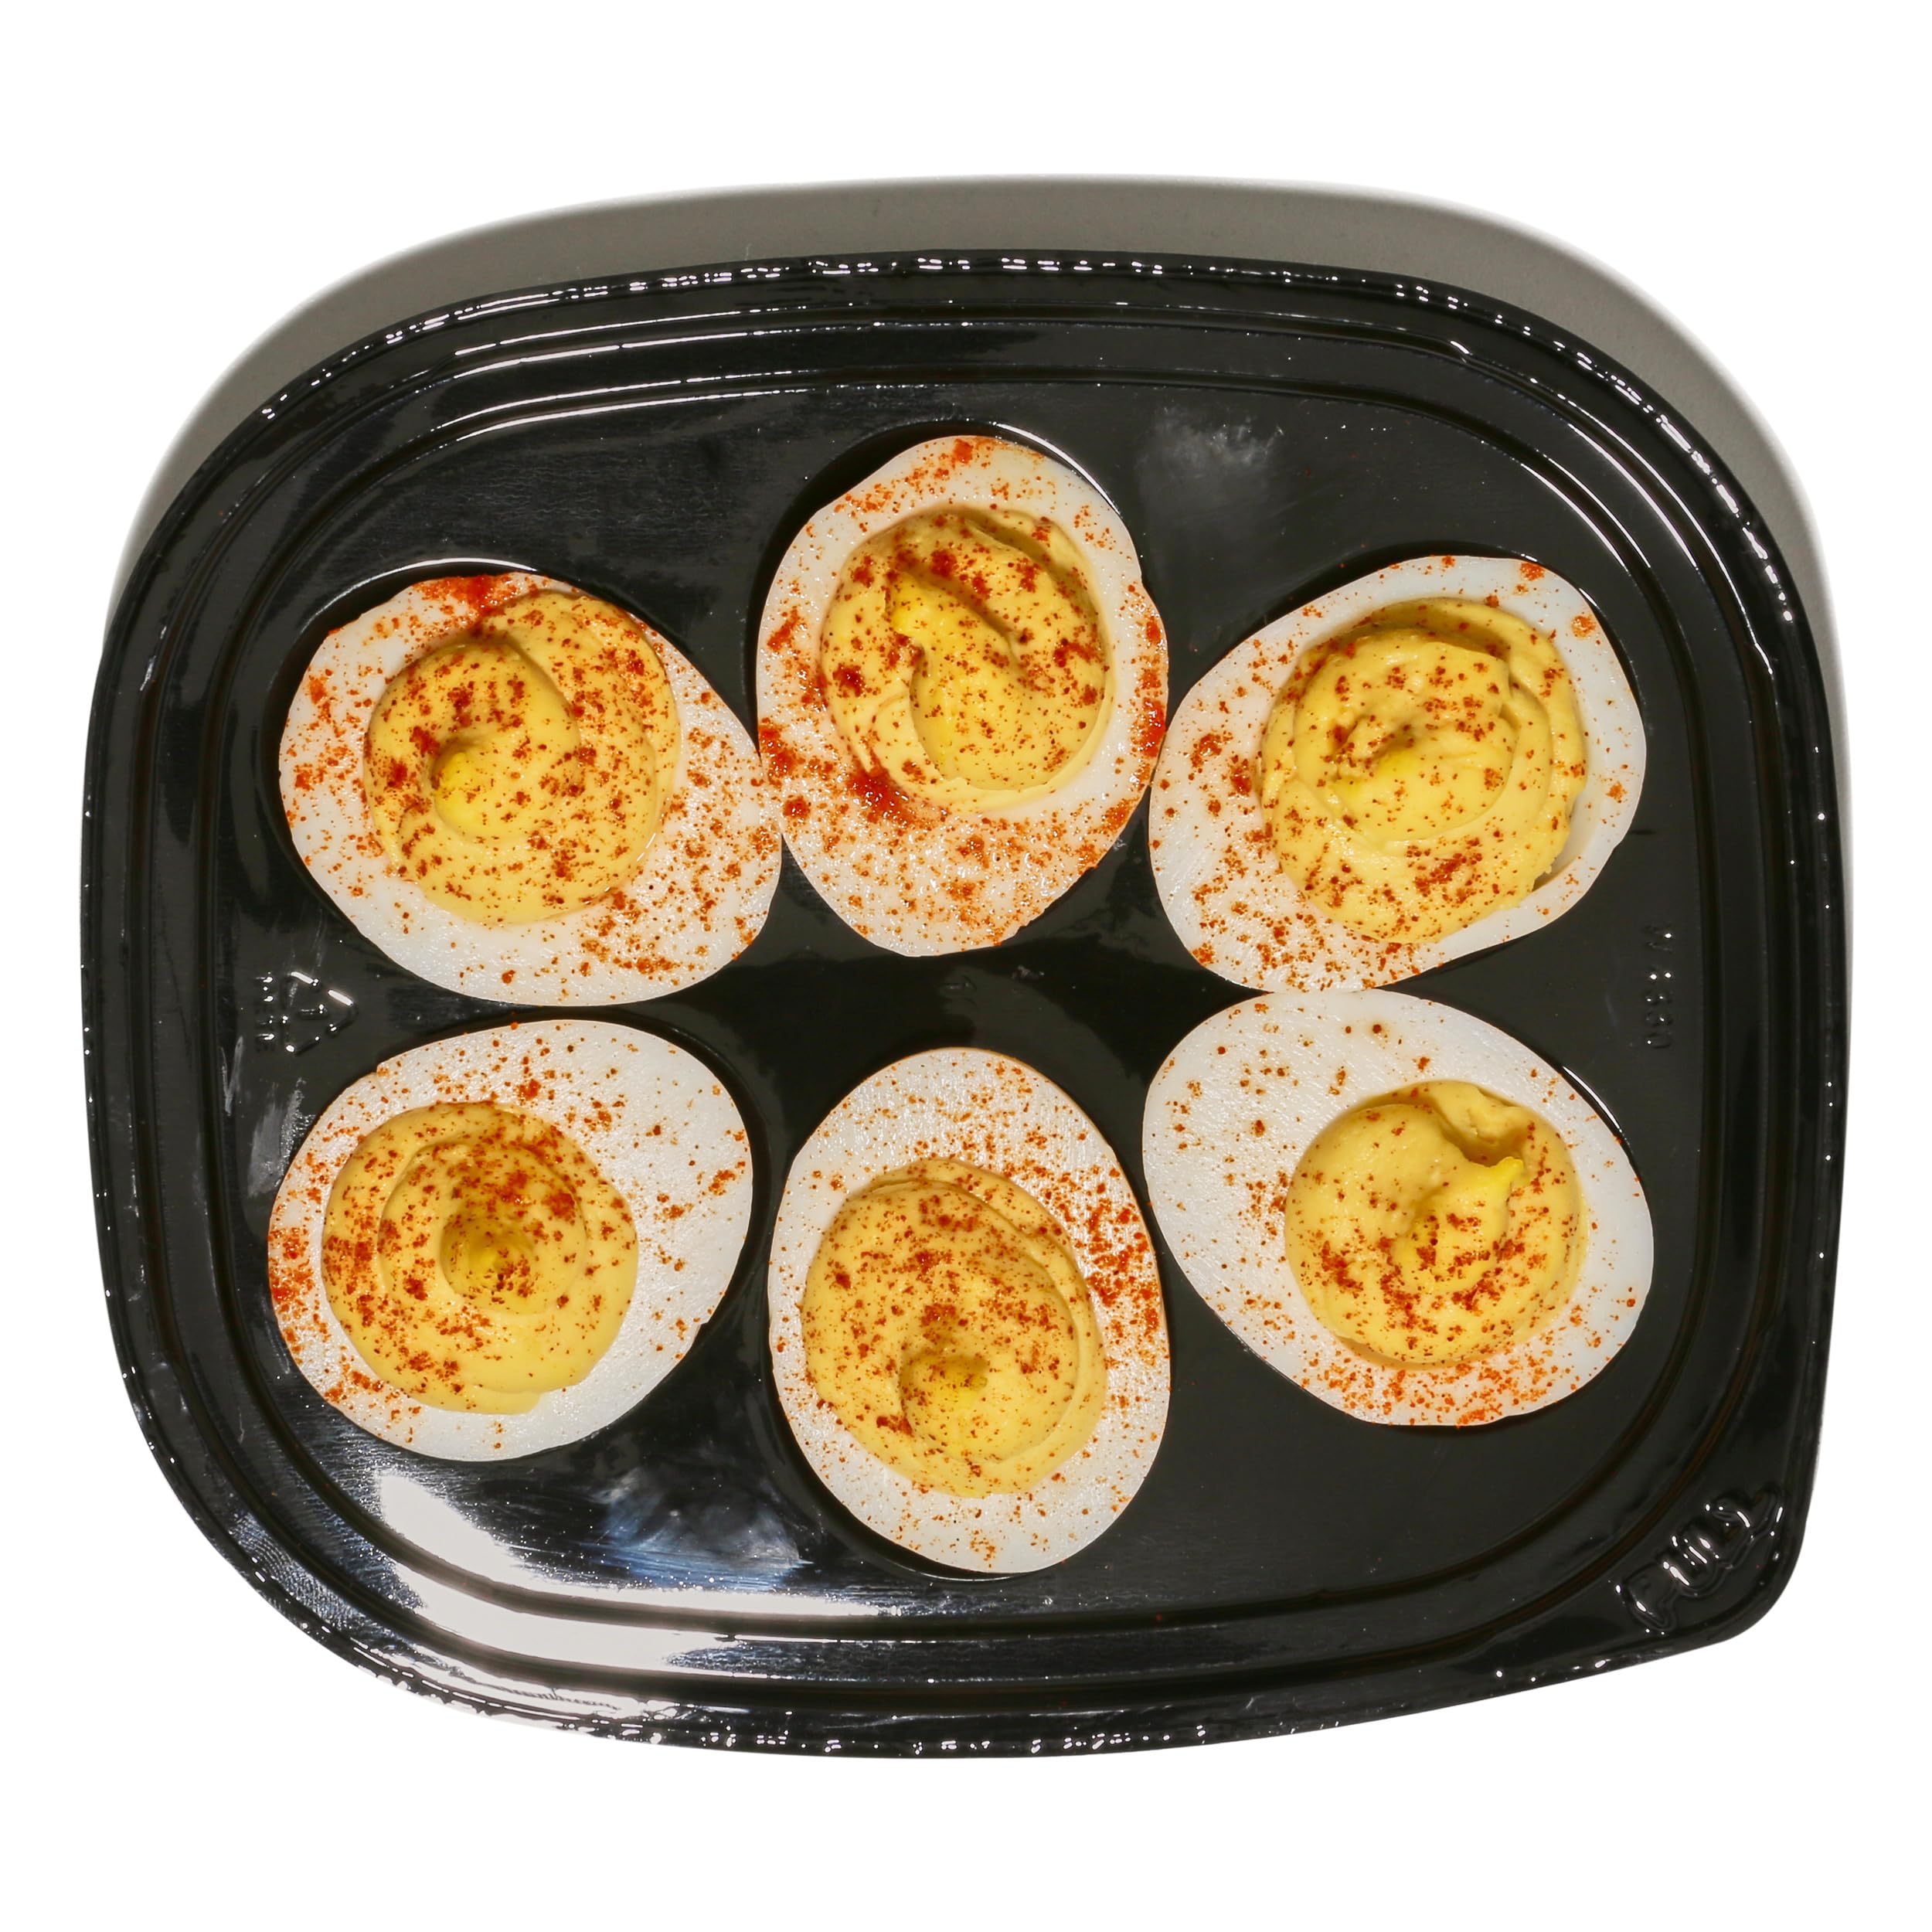
every Whole Foods Market product in stock, cheapest first.





Sold at
Find Whole Foods Market online
Where to find Whole Foods Market · Bay Area
8 storefronts across 1 grocer carry it · tap a pin to open the store.


