Bay Area · 18 grocers · Contested🌡️ heat 35 · WARM
the fruit chips aisle
Bay Area's fruit chips aisle is a fragmented shelf spread across many brands: 126 products from 27 brands across 18 grocers. inka crops owns the most shelf · 36% of SKUs, ahead of barnana. Store brands hold 7%. The shelf leans heart health · 2% of SKUs carry that claim. Verdict: contested · real competition, no single winner (opportunity 64/100).
126
products
27
brands
$6.09
avg price
$0.67-$2.74 /oz
typical range
More in Snacks
Who owns the shelf
brands by share of the fruit chips shelf.
Brand positioning
every brand by share of shelf × price. bubble size = the brand's total reach across all aisles; color = positioning stance. top-right owns the premium end; bottom-right owns the mainstream.
scale
Color:indulgentbetter-for-you
Size:total brand reach (SKUs across all aisles)
price normalized per oz (sizes vary)2 omitted (no oz size)4 omitted (no image)All stores combined.
Market structure
78
highBrand competition
how many brands compete
50
medVariety of offers
how differentiated the shelf is
11
lowTop-brand grip
how much a few brands dominate
64
medLaunch whitespace
room for a new brand
store-brand share: 7% · scores 0-100.
Top products
the fruit chips products in the most Bay Area grocers · widest distribution first.
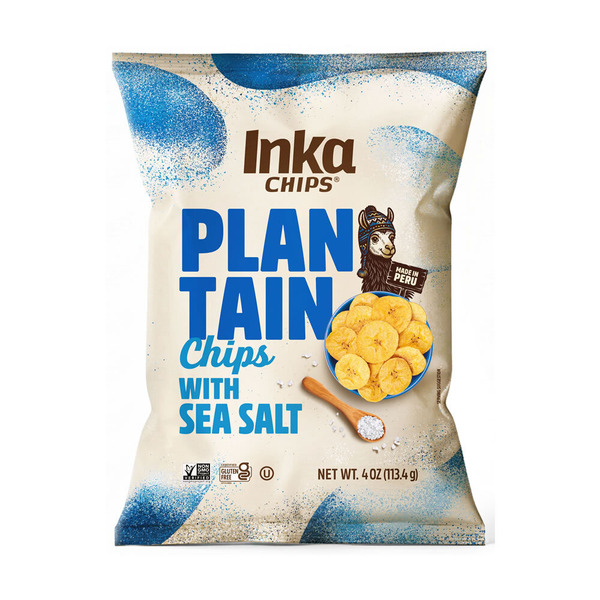
Inka Crops, Inka Chips Plantain Chips with Sea Salt
$2.7911 grocers

Barnana Organic Plantain Chips, Himalayan Pink Salt, Kettle Cooked
$4.508 grocers
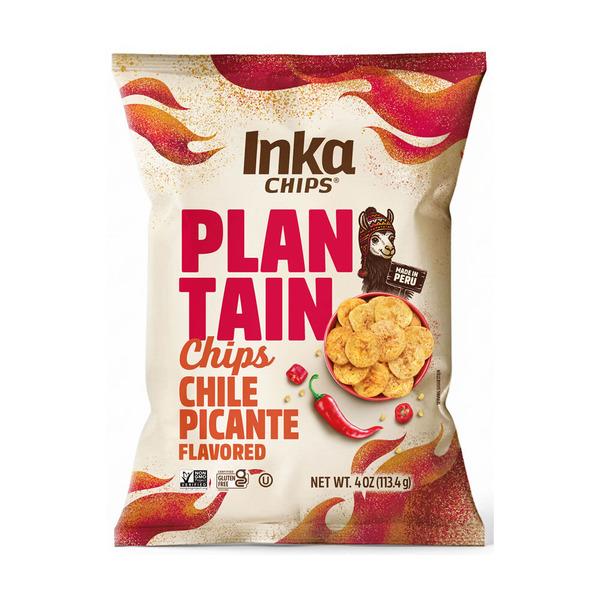
Inka Crops Plantain Chips, Chile Picante
$2.796 grocers
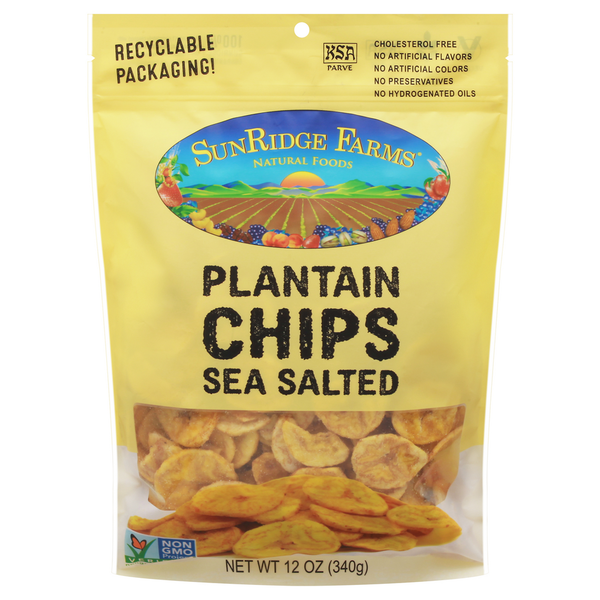
SunRidge Farms Plantain Chips, Sea Salted
$8.096 grocers

Barnana Organic Plantain Chips, Acapulco Lime, Kettle Cooked
$4.505 grocers
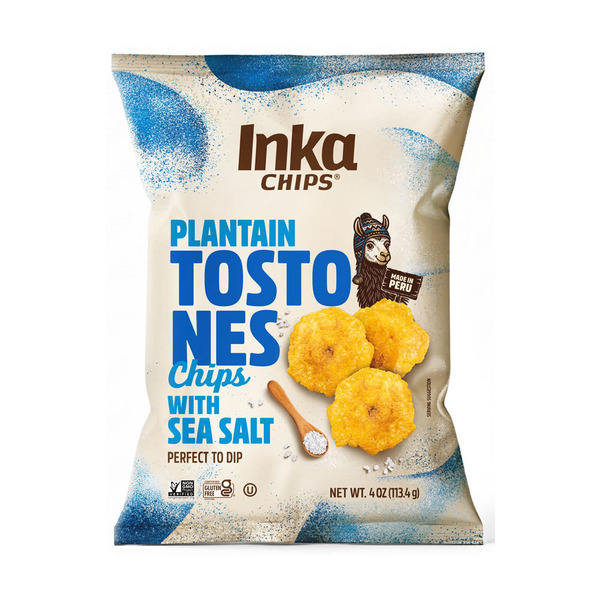
Inka Crops, Inka Chips Plantain Tostones with Sea Salt
$3.394 grocers
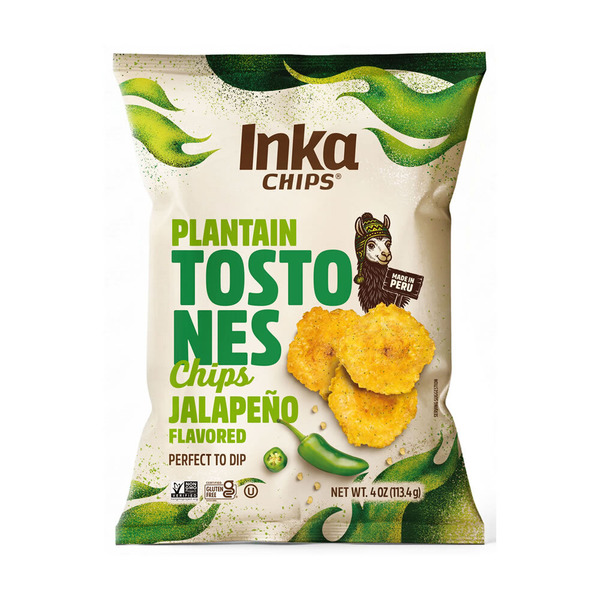
Inka Crops, Inka Chips Plantain Tostones Jalapeno
$4.494 grocers
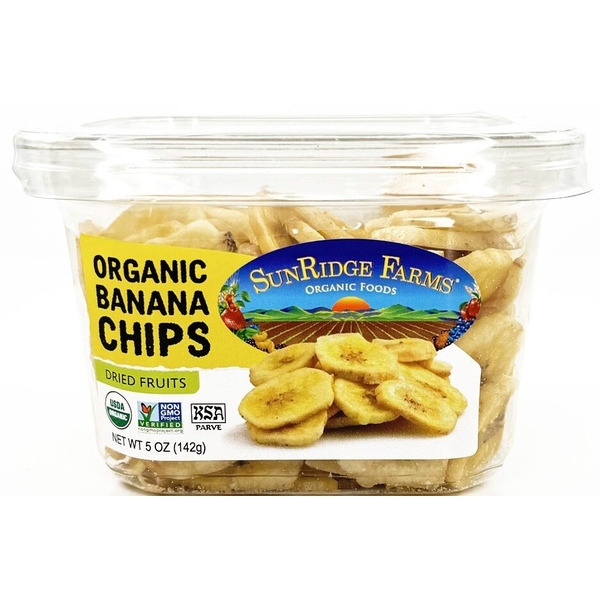
SunRidge Farms Banana Chips, Organic
$4.793 grocers
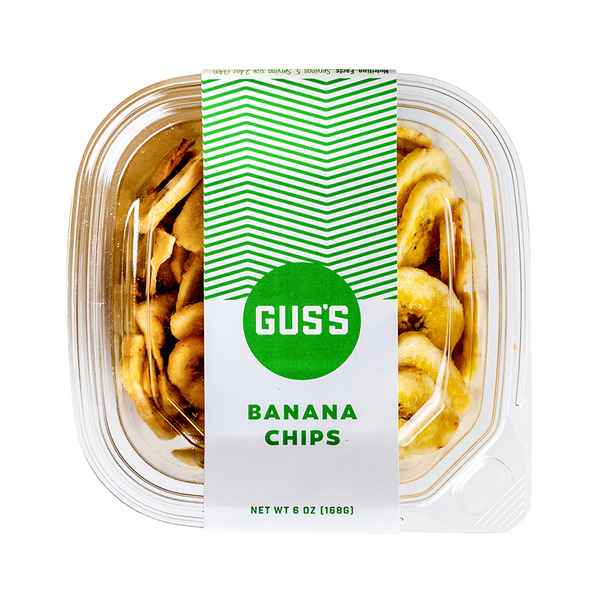
GUS'S Banana Chips
$5.593 grocers
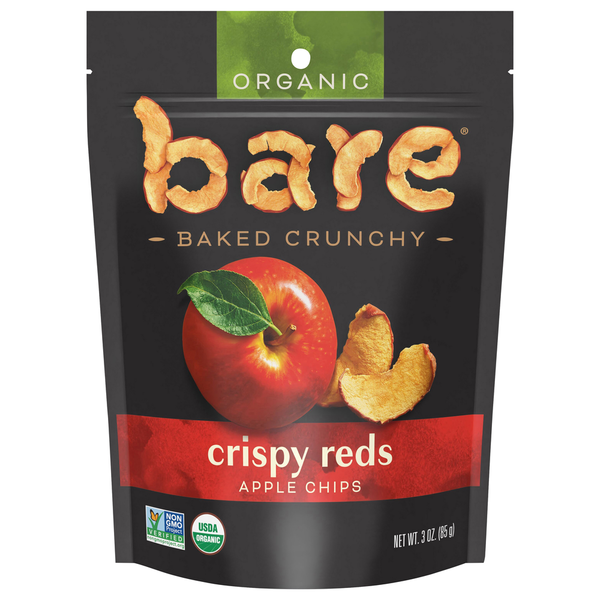
bare Organic Crispy Reds Apple Chips
$7.293 grocers