Bay Area · 5 grocers · Niche🔥 heat 84 · HOT
the pasta aisle
Bay Area's pasta aisle is a niche shelf with only a handful of brands: 7 products from 4 brands across 5 grocers. di baron owns the most shelf · 50% of SKUs, ahead of fratelli minaglia. Verdict: niche · a boutique shelf · only a handful of brands (opportunity 70/100).
7
products
4
brands
$8.16
avg price
$0.33-$0.59 /oz
typical range
More in Pasta
Who owns the shelf
brands by share of the pasta shelf.
How it's positioned
the claims products on this shelf lead with · share of SKUs carrying each.
no positioning claims tagged on this shelf yet.
How this category segments
the ways the pasta shelf actually divides · the dimensions that separate what's on it (★ = the primary cut).
Format★5 segments
Dried
29% · 83
Catch-All
9% · 25
Fresh
7% · 19
Gluten-Free
4% · 10
Specialty
Market structure
20
lowBrand competition
how many brands compete
25
lowVariety of offers
how differentiated the shelf is
39
medTop-brand grip
how much a few brands dominate
70
highLaunch whitespace
room for a new brand
store-brand share: 0% · scores 0-100.
Top products
the pasta products in the most Bay Area grocers · widest distribution first.
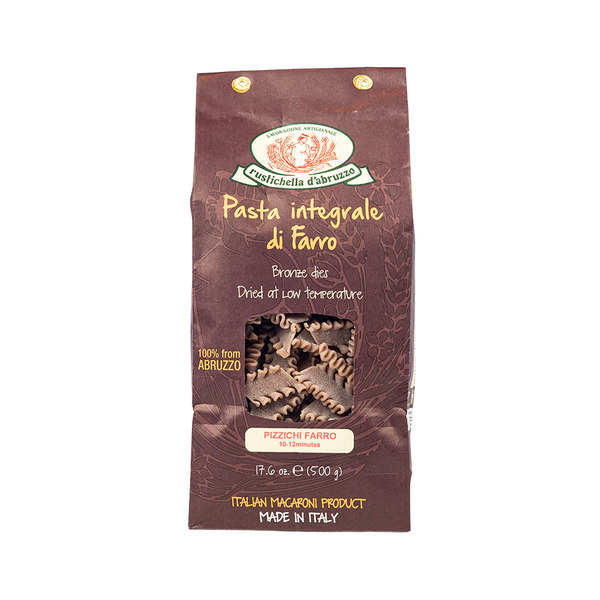
Rustichella D'abruzzo Pizzichi Pasta Italian Macaroni Product
$8.592 grocers
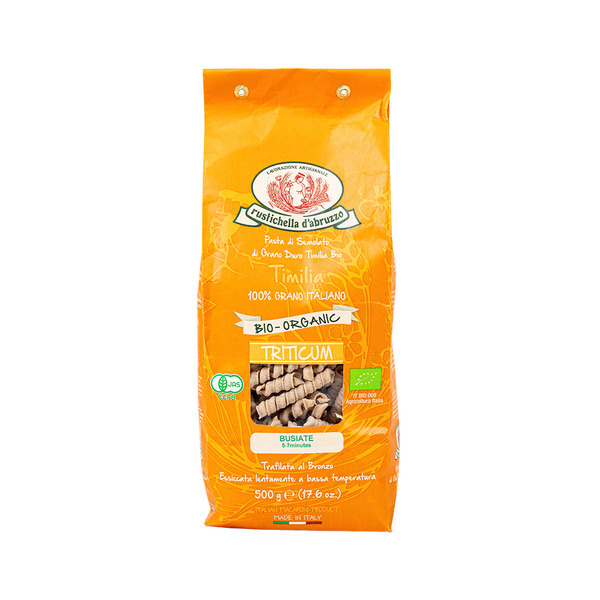
Rustichella D'abruzzo Timilia Busiate Pasta
$9.492 grocers
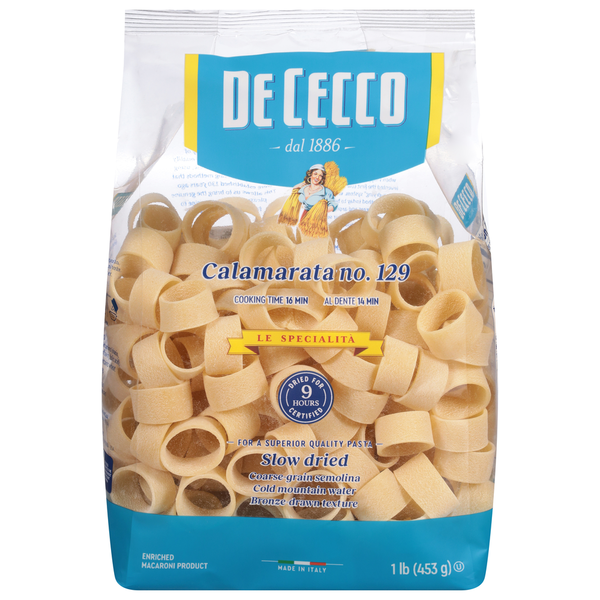
De Cecco Calamarata, No. 129
$5.591 grocer

Di Baron Girelle 100% Italian Organic Durum Wheat Pasta
$5.591 grocer
no image
Fratelli Minaglia Organic Paccheri White Pasta
$7.691 grocer